Stock Name: Barents Sea capelin (ICES subareas 1 and 2 excluding Division 2.a west of 5°W )
Released 18.10.2024
Table 8. updated 17.01.2025
Advice on fishing opportunities
The Joint Russian-Norwegian Working Group on Arctic Fisheries (JRN-AFWG) advises that when the Joint Norwegian–Russian Fisheries Commission management plan is applied, there should be zero catches of Barents Sea capelin in 2025.
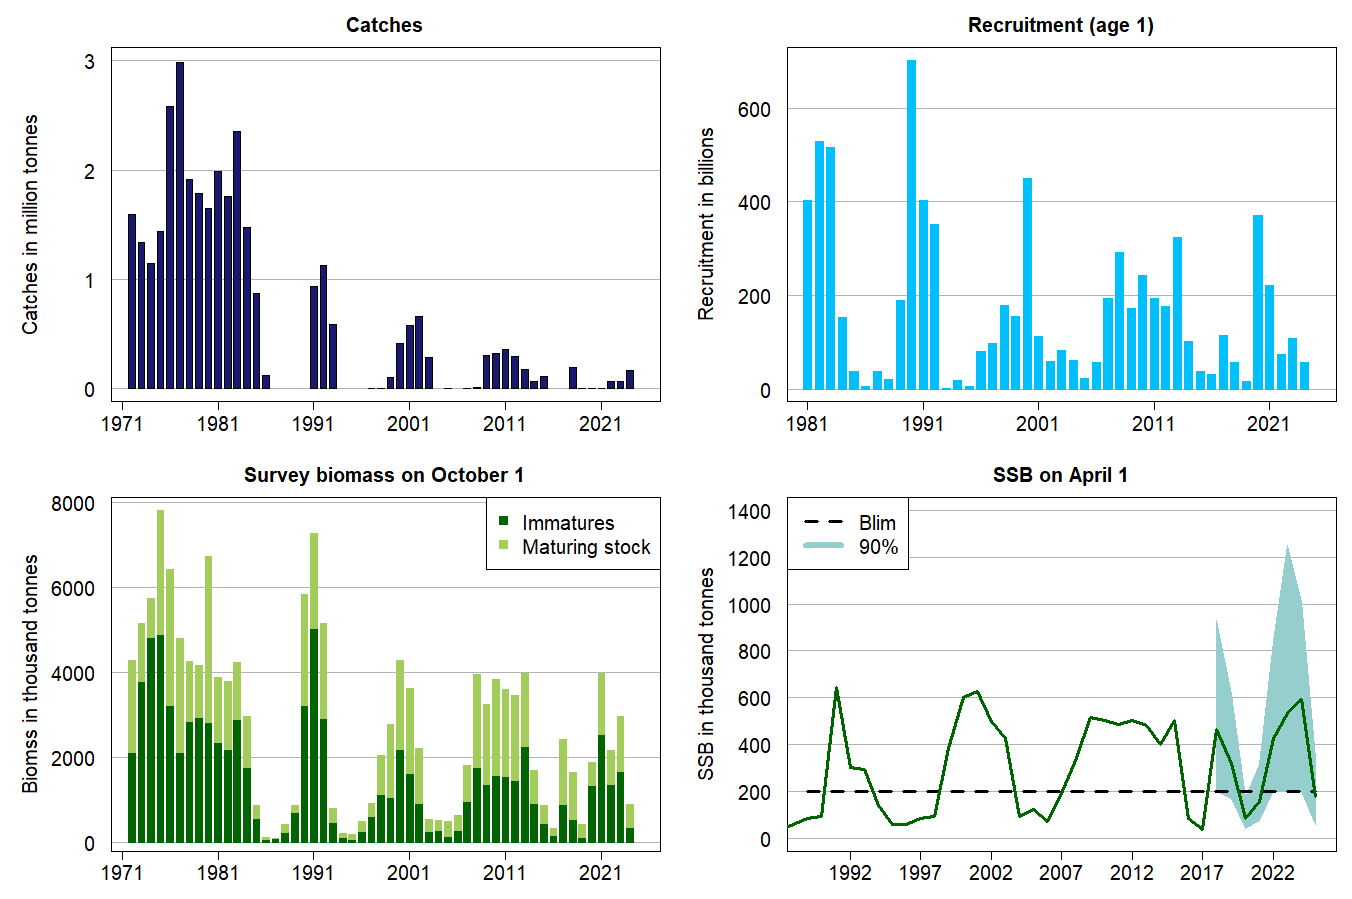
Stock development over time
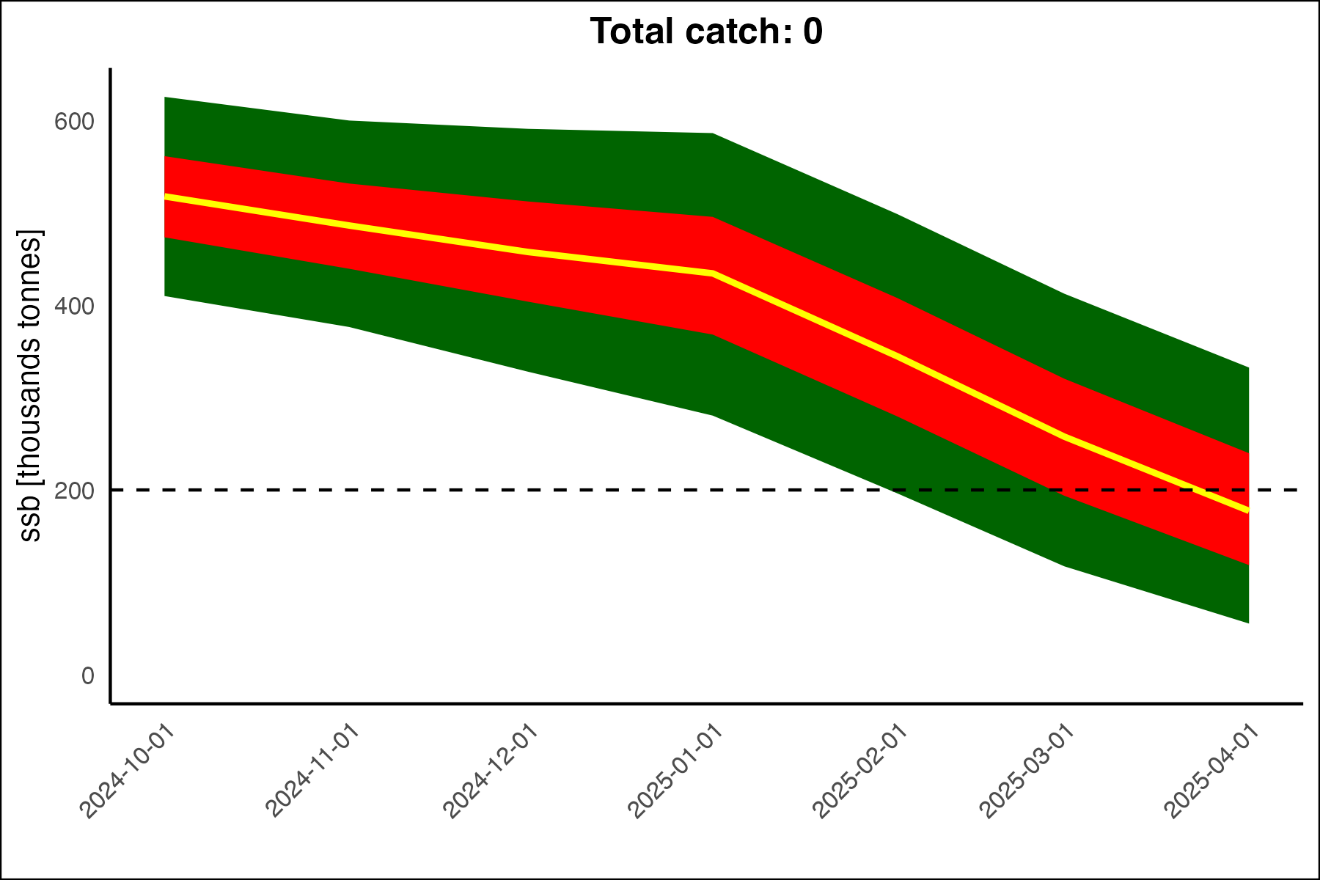
There is less than 95% probability that the spawning stock size will be above Bescapement (200 000 tonnes) in 2025. No reference points for fishing pressure have been defined for this stock.
Catch scenarios
Calculations of catch scenarios are based on a forward projection from the autumn acoustic survey. It involves that SSB for April 2025 is calculated by taking into account predation by immature cod and other sources of natural mortality.
| Variable | Value | Notes |
|---|---|---|
|
Maturing stock biomass 2024 |
534 000 |
Mean biomass of fish at or above the length‑at‑maturity (14 cm), estimated based on the autumn acoustic survey 1 October 2024. These fish are the basis for the spawning stock in April 2025. |
|
Predation by immature cod January–March 2025; from the predation model |
250 000 |
Based on the prediction of cod abundance in 2025 from the 2024 cod stock assessment (JRN-AFWG 2024a). |
| Basis | Total catch (2025) | Median SSB (2025) |
P(SSB 2025 > Bescapement) in % |
% TAC change* | % advice change** |
|---|---|---|---|---|---|
| MP harvest control rule, P (SSB > Bescapement =200 000 t) = 95% | 0 | 177 000 | 40 | -100 | -100 |
| Harvest control rule with P (SSB > Bescapement =150 000 t) = 95% | 0 | 177 000 | 63 | -100 | -100 |
| Harvest control rule with P (SSB > Bescapement =400 000 t) = 95% | 0 | 177 000 | 1 | -100 | -100 |
*TAC (2025) vs. TAC (2024).
**Advice (2025) vs. Advice (2024).
Basis of the advice
| Advice basis | Management plan |
| Management plan |
In 2002, the Joint Norwegian–Russian Fisheries Commission (JNRFC) adopted the following harvest control rule (HCR) for Barents Sea capelin: ‘The TAC for the following year should be set so that, with 95% probability, at least 200 000 tonnes of capelin (Blim) will be allowed to spawn’. ICES evaluated this HCR as well as alternative HCRs suggested by JNRFC in 2016 (ICES, 2016), and only the existing HCR was found to be precautionary. Following ICES evaluation, the JNRFC decided to maintain the existing HCR (JNRFC, 2016). It should be noted that the harvest control rule explicitly refers to Bescapement in the latest benchmark report (ICES, 2023), and Bescapement is set to 200 000 tonnes (Table 4). |
Quality of the assessment
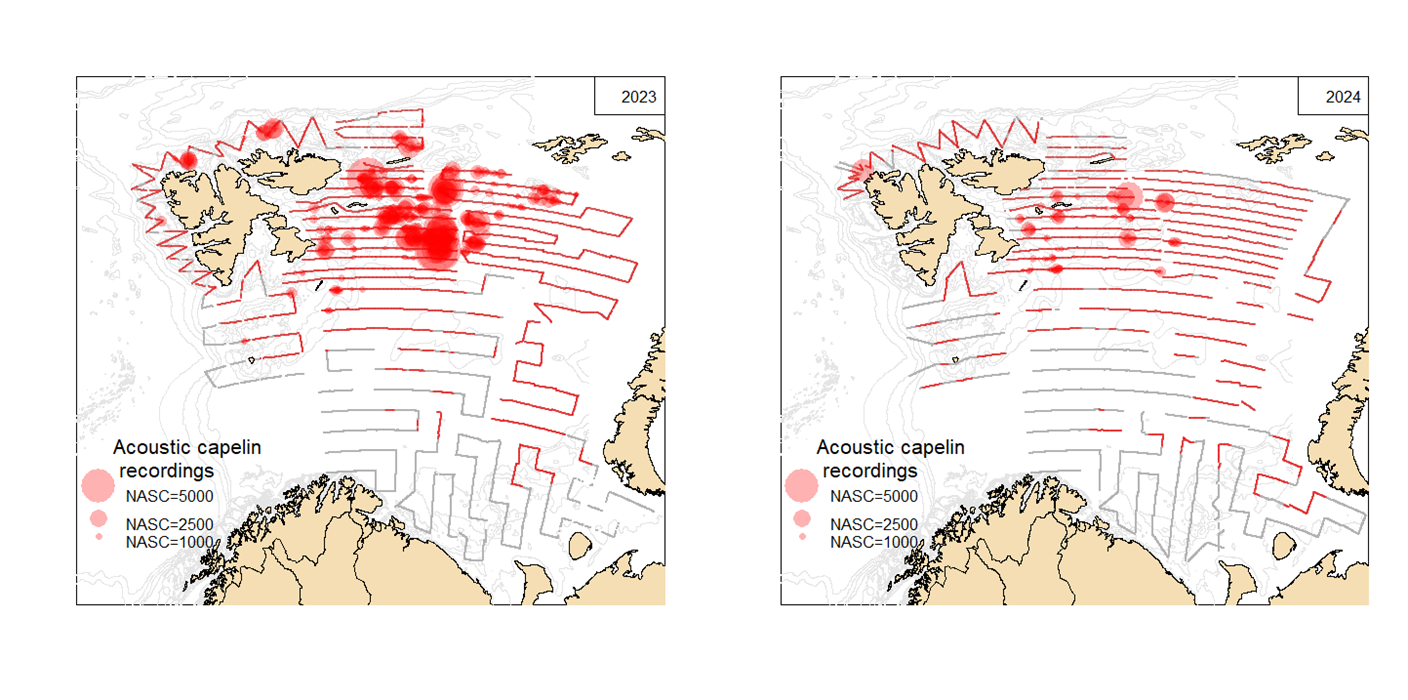
The geographical survey coverage of the Barents Sea capelin stock during the BESS in 2024 was close to complete (Figure 3). In the main distribution area the degree of coverage was very good. The areas west of Svalbard and west of Frans Josef Land were not covered, but in previous years only minor concentrations have been found there.
Issues relevant for the advice
Due to the temporary suspension of Russian scientists from ICES, this assessment was conducted by a Joint Russian-Norwegian working group on Arctic Fisheries (JRN-AFWG) consisting of scientists from VNIRO (Russia) and IMR (Norway) (JRN-AFWG 2024b). This advice has been conducted outside ICES and should not be considered as ICES advice. However, this assessment and advice has been produced following the new methodology agreed and described in detail at the recent ICES benchmark in 2022 (ICES, 2023).
On request from managers (Joint Norwegian-Russian Fisheries Commission), Trochta et al. (2024) assessed harvest control rules for capelin in the Barents Sea using a management strategy evaluation (MSE), a modelling framework that simulates population and fishery responses to management actions. The form of the current escapement rule is retained and is defined by Bescapement, the biomass that should be allowed to escape to spawn after fishing is accounted for. The MSE specifically tested four different Bescapement values (100 000, 150 000, 200 000 and 400 000 tonnes) with and without three alternative fixed minimum quotas (25 000, 50 000 or 75 000 tonnes).
All four Bescapement values without fixed minimum quotas maintained a low risk (<5%) of spawning biomass falling below Blim, the SSB below which recruitment is reduced, assuming historical capelin productivity, accurate survey estimates and that survey precision is correctly estimated. However, a Bescapement equal to 100 000 tonnes showed notably higher risk (of SSB<Blim) if the survey estimate is either biased high or survey precision is lower than assumed in the assessment. High probabilities of fishery closures resulted from Bescapement = 400 000 tonnes. All of the alternative rules using fixed minimum quotas showed very high risk of SSB falling below Blim and the model framework projected reduced future recruitment to the extent of stock collapse over the long term. In Table 2 we have thus provided catch options for the tested Bescapement values which were found to be precautionary, i.e. 150 000, 200 000 (i.e. current HCR) and 400 000 tonnes.
Reference points
| Framework | Reference point | Value | Technical basis | Source |
| MSY approach | MSY Btrigger | |||
| FMSY | ||||
| Precautionary approach | Blim | 68 000 | SSB1990, which was the lowest SSB after the herring collapse that has produced a good year class. SSB estimated on April 1. | ICES (2023a) |
| Bpa | ||||
| Flim | ||||
| Fpa | ||||
| Management plan | Bescapement | 200 000 | The Bescapement used in the HCR corresponds to 95% probability of the SSB being above Bescapement | JNRFC (2016) |
| Fmgt |
Basis of the assessment
| ICES stock data category | 1 (ICES, 2023b). |
| Assessment type | Model based on acoustic survey and prediction six months ahead to calculate spawning biomass. Target escapement strategy used. |
| Input data | Norwegian–Russian acoustic survey in autumn. Model estimates of maturation based on survey data. Natural mortalities from multispecies model (predation by immature cod on prespawning capelin based on information on cod distribution, abundance and stomach content data). |
| Discards and bycatch | All catches are assumed to be landed. The amount of bycaught capelin in other fisheries is very low. |
| Indicators | None. |
| Other information | Latest benchmark was in 2022 (ICES, 2023a). |
| Working group | Joint Russian-Norwegian working group on Arctic Fisheries (JRN-AFWG). |
History of the advice, catch, and management
| Year | ICES /JRN-AFWG advice | Catch corresponding to advice | Agreed TAC | ICES catch |
|---|---|---|---|---|
| 1988 | No catch | 0 | 0 | 0 |
| 1989 | No catch | 0 | 0 | 0 |
| 1990 | No catch | 0 | 0 | 0 |
| 1991 | TAC | 1000000 | 900000 | 933000 |
| 1992 | SSB > 400 000–500000 t | 834000 | 1100000 | 1123000 |
| 1993 | A cautious approach, SSB > 400 000–500 000 t | 600000 | 630000 | 586000 |
| 1994 | No fishing | 0 | 0 | 0 |
| 1995 | No fishing | 0 | 0 | 0 |
| 1996 | No fishing | 0 | 0 | 0 |
| 1997 | No fishing | 0 | 0 | 1000 |
| 1998 | No fishing | 0 | 0 | 3000 |
| 1999 | SSB > 500 000 t | 79000 | 80000 | 101000 |
| 2000 | 5% probability of SSB < 200 000 t | 435000 | 435000 | 414000 |
| 2001 | 5% probability of SSB < 200 000 t | 630000 | 630000 | 568000 |
| 2002 | 5% probability of SSB < 200 000 t | 650000 | 650000 | 651000 |
| 2003 | 5% probability of SSB < 200 000 t | 310000 | 310000 | 282000 |
| 2004 | No fishing | 0 | 0 | 0 |
| 2005 | No fishing | 0 | 0 | 1000* |
| 2006 | No fishing | 0 | 0 | 0 |
| 2007 | No fishing | 0 | 0 | 4000* |
| 2008 | No fishing | 0 | 0 | 12000* |
| 2009 | 5% probability of SSB < 200 000 t | 390000 | 390000 | 307000 |
| 2010 | 5% probability of SSB < 200 000 t | 360000 | 360000 | 323000 |
| 2011 | 5% probability of SSB < 200 000 t | 380000 | 380000 | 360000 |
| 2012 | 5% probability of SSB < 200 000 t | 320000 | 320000 | 296000 |
| 2013 | 5% probability of SSB < 200 000 t | 200000 | 200000 | 177000 |
| 2014 | 5% probability of SSB < 200 000 t | 65000 | 65000 | 66000 |
| 2015 | 5% probability of SSB < 200 000 t | 6000 | 120000 | 115000 |
| 2016 | Zero catch | 0 | 0 | 0 |
| 2017 | Zero catch | 0 | 0 | 0 |
| 2018 | 5% probability of SSB < 200 000 t | 205000 | 205000 | 194520 |
| 2019 | Zero catch | 0 | 0 ** | 53* |
| 2020 | Management plan | 0 | 0** | 31* |
| 2021 | Management plan | 0 | 0** | 10* |
| 2022 | Management plan | ≤ 70000 | 70000 | 65246*** |
| 2023 | Management plan*** | ≤ 62000*** | 62000 | 60692*** |
| 2024 | Management plan*** | ≤ 196000*** | 196000 | 168680*** |
| 2025 | Management plan*** | 0*** |
*Research catch and bycatches in other fisheries.
**Up to 500 tonnes was allowed for research survey catches.
***In 2022-2024 assessment and advice was carried out by the Joint Russian-Norwegian working group on Arctic Fisheries (JRN-AFWG) which compiled catches and gave advice.
History of catch and landings
| Year | Winter | Summer–Autumn | Year total | |||||
|---|---|---|---|---|---|---|---|---|
| Norway | Russia | Others | Total | Norway | Russia | Total | ||
| 1965 | 217000 | 7000 | 0 | 224000 | 0 | 0 | 0 | 224000 |
| 1966 | 380000 | 9000 | 0 | 389000 | 0 | 0 | 0 | 389000 |
| 1967 | 403000 | 6000 | 0 | 409000 | 0 | 0 | 0 | 409000 |
| 1968 | 460000 | 15000 | 0 | 475000 | 62000 | 0 | 62000 | 537000 |
| 1969 | 436000 | 1000 | 0 | 437000 | 243000 | 0 | 243000 | 680000 |
| 1970 | 955000 | 8000 | 0 | 963000 | 346000 | 5000 | 351000 | 1314000 |
| 1971 | 1300000 | 14000 | 0 | 1314000 | 71000 | 7000 | 78000 | 1392000 |
| 1972 | 1208000 | 24000 | 0 | 1232000 | 347000 | 13000 | 360000 | 1591000 |
| 1973 | 1078000 | 34000 | 0 | 1112000 | 213000 | 12000 | 225000 | 1337000 |
| 1974 | 749000 | 63000 | 0 | 812000 | 237000 | 99000 | 336000 | 1148000 |
| 1975 | 559000 | 301000 | 43000 | 903000 | 407000 | 131000 | 538000 | 1441000 |
| 1976 | 1252000 | 228000 | 0 | 1480000 | 739000 | 368000 | 1107000 | 2587000 |
| 1977 | 1441000 | 317000 | 2000 | 1760000 | 722000 | 504000 | 1226000 | 2986000 |
| 1978 | 784000 | 429000 | 25000 | 1238000 | 360000 | 318000 | 678000 | 1916000 |
| 1979 | 539000 | 342000 | 5000 | 886000 | 570000 | 326000 | 896000 | 1782000 |
| 1980 | 539000 | 253000 | 9000 | 801000 | 459000 | 388000 | 847000 | 1648000 |
| 1981 | 784000 | 429000 | 28000 | 1241000 | 454000 | 292000 | 746000 | 1986000 |
| 1982 | 568000 | 260000 | 5000 | 833000 | 591000 | 336000 | 927000 | 1760000 |
| 1983 | 751000 | 373000 | 36000 | 1160000 | 758000 | 439000 | 1197000 | 2357000 |
| 1984 | 330000 | 257000 | 42000 | 629000 | 481000 | 368000 | 849000 | 1477000 |
| 1985 | 340000 | 234000 | 17000 | 591000 | 113000 | 164000 | 277000 | 868000 |
| 1986 | 72000 | 51000 | 0 | 123000 | 0 | 0 | 0 | 123000 |
| 1987 | 0 | 0 | 0 | 0 | 0 | 0 | 0 | 0 |
| 1988 | 0 | 0 | 0 | 0 | 0 | 0 | 0 | 0 |
| 1989 | 0 | 0 | 0 | 0 | 0 | 0 | 0 | 0 |
| 1990 | 0 | 0 | 0 | 0 | 0 | 0 | 0 | 0 |
| 1991 | 528000 | 159000 | 20000 | 707000 | 31000 | 195000 | 226000 | 933000 |
| 1992 | 620000 | 247000 | 24000 | 891000 | 73000 | 159000 | 232000 | 1123000 |
| 1993 | 402000 | 170000 | 14000 | 586000 | 0 | 0 | 0 | 586000 |
| 1994 | 0 | 0 | 0 | 0 | 0 | 0 | 0 | 0 |
| 1995 | 0 | 0 | 0 | 0 | 0 | 0 | 0 | 0 |
| 1996 | 0 | 0 | 0 | 0 | 0 | 0 | 0 | 0 |
| 1997 | 0 | 0 | 0 | 0 | 0 | 1000 | 1000 | 1000 |
| 1998 | 0 | 2000 | 0 | 2000 | 0 | 1000 | 1000 | 3000 |
| 1999 | 50000 | 33000 | 0 | 83000 | 0 | 22000 | 22000 | 105000 |
| 2000 | 279000 | 94000 | 8000 | 381000 | 0 | 29000 | 29000 | 410000 |
| 2001 | 376000 | 180000 | 8000 | 564000 | 0 | 14000 | 14000 | 578000 |
| 2002 | 398000 | 228000 | 17000 | 643000 | 0 | 16000 | 16000 | 659000 |
| 2003 | 180000 | 93000 | 9000 | 282000 | 0 | 0 | 0 | 282000 |
| 2004 | 0 | 0 | 0 | 0 | 0 | 0 | 0 | 0 |
| 2005 | 1000 | 0 | 0 | 1000 | 0 | 0 | 0 | 1000 |
| 2006 | 0 | 0 | 0 | 0 | 0 | 0 | 0 | 0 |
| 2007 | 2000 | 2000 | 0 | 4000 | 0 | 0 | 0 | 4000 |
| 2008 | 5000 | 5000 | 0 | 10000 | 0 | 2000 | 2000 | 12000 |
| 2009 | 233000 | 73000 | 0 | 306000 | 0 | 1000 | 1000 | 307000 |
| 2010 | 246000 | 77000 | 0 | 323000 | 0 | 0 | 0 | 323000 |
| 2011 | 273000 | 87000 | 0 | 360000 | 0 | 0 | 0 | 360000 |
| 2012 | 228000 | 68000 | 0 | 296000 | 0 | 0 | 0 | 296000 |
| 2013 | 116000 | 60000 | 0 | 177000 | 0 | 0 | 0 | 177000 |
| 2014 | 40000 | 26000 | 0 | 66000 | 0 | 0 | 0 | 66000 |
| 2015 | 71000 | 44000 | 0 | 115000 | 0 | 0 | 0 | 115000 |
| 2016 | 0 | 0 | 0 | 0 | 0 | 0 | 0 | 0 |
| 2017 | 0 | 0 | 0 | 0 | 0 | 0 | 0 | 0 |
| 2018 | 128520 | 66000 | 0 | 194520 | 0 | 0 | 0 | 194520 |
| 2019 | 5 | 0 | 0 | 0 | 0 | 0 | 0 | 53 |
| 2020 | 9 | 0 | 0 | 9 | 0 | 21 | 0 | 31 |
| 2021 | 2 | 0 | 0 | 2 | 0 | 8 | 0 | 10 |
| 2022 | 42597 | 22646 | 0 | 65243 | 0 | 3 | 3 | 65246 |
| 2023 | 37652 | 23040 | 0 | 60692 | 0 | 0 | 0 | 60692 |
| 2024 | 117555 | 51125 | 0 | 168680 | ||||
Summary of the assessment
| Year | Predicted SSB assuming catch = advised catch, 1 April | Recruitment from autumn acoustic survey, 1 October | Stock biomass from autumn acoustic survey, 1 October | Catch | |||
|---|---|---|---|---|---|---|---|
| Median | 5th percentile | 95th percentile | Immature | Maturing biomass | |||
| tonnes | Age 1, millions | tonnes | |||||
| 1973 | 3796000 | 1350000 | 1337000 | ||||
| 1974 | 4831000 | 907000 | 1148000 | ||||
| 1975 | 4900000 | 2916000 | 1441000 | ||||
| 1976 | 3220000 | 3200000 | 2587000 | ||||
| 1977 | 2127000 | 2676000 | 2986000 | ||||
| 1978 | 2845000 | 1402000 | 1916000 | ||||
| 1979 | 2934000 | 1227000 | 1782000 | ||||
| 1980 | 2810000 | 3913000 | 1648000 | ||||
| 1981 | 402560 | 2341000 | 1551000 | 1986000 | |||
| 1982 | 528310 | 2187000 | 1591000 | 1760000 | |||
| 1983 | 514880 | 2897000 | 1329000 | 2357000 | |||
| 1984 | 154750 | 1756000 | 1208000 | 1477000 | |||
| 1985 | 38690 | 572000 | 285000 | 868000 | |||
| 1986 | 6029 | 55000 | 65000 | 123000 | |||
| 1987 | 37578 | 83000 | 17000 | 0 | |||
| 1988 | 20987 | 227000 | 200000 | 0 | |||
| 1989 | 84000 | 189200 | 695000 | 174000 | 0 | ||
| 1990 | 92000 | 700370 | 3221000 | 2617000 | 0 | ||
| 1991 | 643000 | 402090 | 5034000 | 2248000 | 933000 | ||
| 1992 | 302000 | 351290 | 2927000 | 2228000 | 1123000 | ||
| 1993 | 293000 | 2237 | 467000 | 330000 | 586000 | ||
| 1994 | 139000 | 19761 | 105000 | 94000 | 0 | ||
| 1995 | 60000 | 7130 | 75000 | 118000 | 0 | ||
| 1996 | 60000 | 81907 | 254000 | 248000 | 0 | ||
| 1997 | 85000 | 98876 | 598000 | 312000 | 1000 | ||
| 1998 | 94000 | 179026 | 1123000 | 932000 | 3000 | ||
| 1999 | 382000 | 155921 | 1056000 | 1718000 | 105000 | ||
| 2000 | 599000 | 449166 | 2177000 | 2097000 | 410000 | ||
| 2001 | 626000 | 113587 | 1610000 | 2019000 | 578000 | ||
| 2002 | 496000 | 59703 | 919000 | 1290000 | 659000 | ||
| 2003 | 427000 | 82444 | 254000 | 280000 | 282000 | ||
| 2004 | 94000 | 62056 | 289000 | 225000 | 0 | ||
| 2005 | 122000 | 22661 | 143000 | 355000 | 1000 | ||
| 2006 | 72000 | 57294 | 289000 | 348000 | 0 | ||
| 2007 | 189000 | 195125 | 970000 | 846000 | 4000 | ||
| 2008 | 330000 | 292392 | 1766000 | 2186000 | 12000 | ||
| 2009 | 517000 | 172754 | 1355000 | 1892000 | 307000 | ||
| 2010 | 504000 | 243649 | 1576000 | 2248000 | 323000 | ||
| 2011 | 487000 | 194255 | 1544000 | 2059000 | 360000 | ||
| 2012 | 504000 | 176130 | 1460000 | 1996000 | 296000 | ||
| 2013 | 479000 | 323845 | 2248000 | 1725000 | 177000 | ||
| 2014 | 399000 | 103136 | 904000 | 785000 | 66000 | ||
| 2015 | 504000 | 37832 | 444000 | 434000 | 115000 | ||
| 2016 | 82000 | 32575 | 163000 | 153000 | 0 | ||
| 2017 | 37000 | 115370 | 882000 | 1547000 | 0 | ||
| 2018 | 462000 | 200000 | 930000 | 58812 | 541000 | 1100000 | 194520 |
| 2019 | 317000 | 168282 | 613733 | 18029 | 111000 | 302000 | 53 |
| 2020 | 85110 | 38830 | 171850 | 370016 | 1348000 | 542000 | 31 |
| 2021 | 156376 | 75197 | 314559 | 222667 | 2528000 | 1459000 | 10 |
| 2022 | 423751 | 201897 | 838670 | 75460* | 1356000* | 817000* | 65246 |
| 2023 | 534000 | 201000 | 1250000 | 108509 | 1666000 | 1286000 | 60692 |
| 2024 | 590000 | 201000 | 1011000 | 58560 | 353000 | 534000 | 168680 |
| 2025 | 177000 | 56000 | 332000 | ||||
*Not adjusted for incomplete survey coverage.
References
ICES 2001. Barents Sea capelin (Subareas I and II, excluding Division IIa west of 5°W). In Report of the Advisory Committee on Fishery Management, 2001, Part 1, Section 3.1.8, pp. 65–70. ICES Cooperative Research Report No. 246. 921 pp. https://doi.org/10.17895/ices.pub.5383.
ICES 2016. Report of the second Workshop on Management Plan Evaluation on Northeast Arctic cod and haddock and Barents Sea capelin, 25–28 January 2016, Kirkenes, Norway. ICES CM 2016/ACOM:47. 76 pp. https://doi.org/10.17895/ices.pub.5296.
ICES 2023a. Benchmark workshop on capelin (WKCAPELIN). ICES Scientific Reports. 5:62. 282 pp. https://doi.org/10.17895/ices.pub.23260388
ICES 2023b. Advice on fishing opportunities. In Report of the ICES Advisory Committee, 2023. ICES Advice 2023, section 1.1.1. https://doi.org/10.17895/ices.advice.22240624
JNRFC 2016. Protocol of the 46th Session of the Joint Norwegian–Russian Fisheries Commission, Annex 12. Translated from Norwegian to English. For an accurate interpretation, please consult the text in the official languages of the Commission (Norwegian and Russian) at https://www.jointfish.com/content/download/501/6352/file/46-norsk.pdf (Norwegian) and https://www.jointfish.com/rus/content/download/502/6357/file/46-russisk.pdf (Russian).
JRN-AFWG 2024a. Report of the Joint Russian-Norwegian Working Group on Arctic Fisheries (JRN-AFWG) 2024. IMR-PINRO report series 7-2024, 305 pp.
JRN-AFWG 2024b. Report of capelin assessment by the Joint Russian-Norwegian Working Group on Arctic Fisheries (JRN-AFWG) 2024. IMR-PINRO 16-2024.
Trochta, J., B. Bogstad, Y. Kovalev, D. Prozorkevich, G. Skaret, S. Vatnehol, and D. Howell. 2024. Report on evaluation of harvest rules for Barents Sea capelin in subareas 1 and 2 (Northeast Arctic), excluding Division 2.a west of 5°W. - full report. IMR-PINRO 2024-17