Statusvurdering av biologisk mangfold inngår i det nasjonale grunnlaget for økosystembasert forvaltning og i internasjonale avtaler om bevaring av biologisk mangfold. Her presenterer vi fiskedata fra økosystemtoktet i Barentshavet 2004-2019 på et format som er egnet for statusvurdering av biodiversitet. Økosystemtoktet gjennomføres årlig av Norge og Russland. Vi presenterer en referanseliste for Barentshavsfisk som vi bruker i programvaren StoX versjon 3.0 for å oversette og eksportere data fra rådata xlm-filer i NMDBiotic v3-format til et format som er egnet for mangfoldsanalyse. Vi presenterer også noen eksempler på resultater basert på fiskedataene fra 2004-2019.
Fish diversity data from the Barents Sea Ecosystem Survey 2004-2019
Report series:
Rapport fra havforskningen 2021-15
ISSN: 1893-4536
Published: 12.04.2021
Research group(s):
Benthic communities
,
Fisheries dynamics
,
Acoustics and Observation Methodologies
,
Ecosystem processes
Subject:
The ocean coast and fjords
Program:
The Barents Sea and Arctic Ocean Ecosystems
Research group leader(s):
Jane Aanestad Godiksen (Demersal fish)
Approved by:
Research Director(s):
Geir Huse
Program leader(s):
Maria Fossheim
Norsk sammendrag
Summary
Assessing and improving the status of biodiversity are main targets of international agreements such as the Convention on Biological Diversity and the associated Aichi Biodiversity Targets for 2020. Here we present fish data from the Barents Sea Ecosystem Survey 2004-2019 on a format suitable for biodiversity assessments. The Barents Sea Ecosystem Survey is run jointly by the Institute of Marine Research (IMR, Norway) and the Polar Research Institute of Marine Fisheries and Oceanography (PINRO, Russia) - since 2019 - Polar Branch of Russian Federal Research Institute of Fisheries and Oceanography (VNIRO). We present a Barents Sea Fish Species Reference List that we use with the software StoX version 3.0 to translate and export data from raw data xlm -files in the NMDBiotic v3 format stored at IMR to a format suitable for diversity analysis. Finally, we present some example results based on the fish data from the Barents Sea ecosystem survey 2004-2019.
1 - Introduction
Assessing and improving the status of biodiversity are main targets of international agreements such as the Convention on Biological Diversity and the associated Aichi Biodiversity Targets for 2020 ( https://www.cbd.int/sp/targets/ ), and the management of marine ecosystems at national levels as stated in legal documents such as "Havressursloven" in Norway (https://lovdata.no/dokument/NL/lov/2008-06-06-37). Assessing biodiversity includes evaluating species richness, relative abundance of the various species, as well as changes in species composition and relative abundance over time and in space at different scales (Magurran 2004, Yoccoz et al 2019).
Here we present fish data from the Barents Sea Ecosystem Survey 2004-2019 on a format suitable for biodiversity assessments. The Barents Sea Ecosystem Survey is run jointly by the Institute of Marine Research (IMR, Norway) and the Polar Research Institute of Marine Fisheries and Oceanography (since 2019 – Polar Branch of Russian Federal Research Institute of Fisheries and Oceanography) (PINRO, Russia). The data presented here is the result of comprehensive and continuing efforts to improve the quality of sampling and identification of fishes caught at the Barents Sea Ecosystem Survey. The efforts include joint workshops on fish taxonomy, development of joint identification keys and cooperation with external experts.
In this report, we present a Barents Sea Fish Species Reference List that we use with the software StoX (Johnsen et al 2019) version 3.0 to translate and export data from raw data xlm -files in the NMDBiotic v3 format stored at IMR to a format suitable for diversity analysis. The fish diversity data from the ecosystem survey has already been used to document changes in the Barents Sea fish community from 2004 to 2012. However, due to changes in data format and data storage at IMR, the data set has not been updated on a regular basis. Here, we present some example results based on the fish data from the Barents Sea ecosystem survey 2004-2019.
The StoX models by year including the input and output data from Norwegian vessels 2004-2019 can be found here Data sets | NMDC. The plan is to add new data every year after each survey when the survey report is ready.
2 - Generating the Barents Sea fish diversity data
2.1 - Input data
2.1.1 - Sampling at Sea
The Barents Sea Ecosystem Survey has been run annually in August-September since 2004 in a cooperation between Norway and Russia. Generally, Norway covers the Norwegian Exclusive Economic Zone and Russia the Russian Exclusive Economic Zone (Figure 1). Description of survey design, methodology, gear etc can be found in Johannesen et al (2019) and in the annual survey reports (Appendix 1). The survey covers the whole Barents Sea shelf, but ice hindrance, reduced access and limited survey time has limited coverage in some areas (Figure 2, see also Figure 6). The main design of trawl stations is a 35x35 nm 2 regular grid with some deviations (see Johannesen et al 2019 for details). Generally, the number of demersal trawl stations sampled each year has declined (Figure 3).
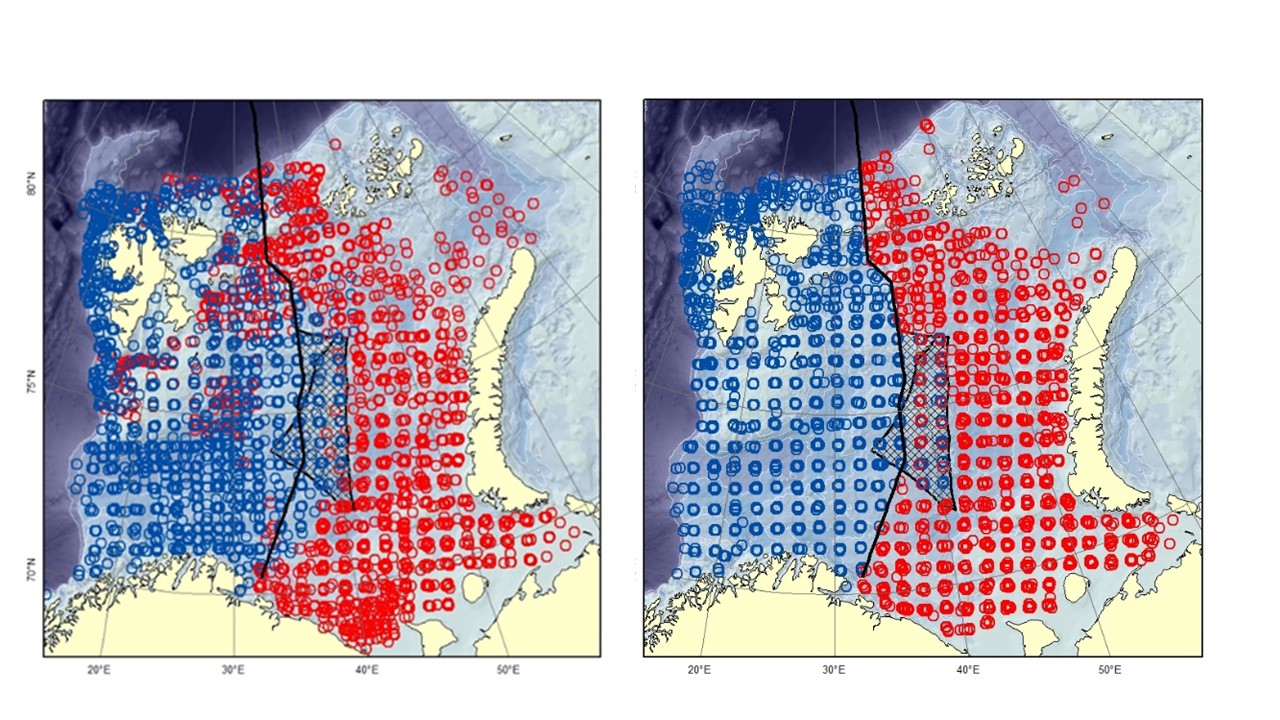
Figure 1. Demersal trawl stations taken at the Barents Sea Ecosystem Survey. Red stations are taken by Russian vessels, blue by Norwegian vessels. The black line is the division line between the Russian and Norwegian Exclusive Economic Zone agreed upon in 2010. The hatched area is the “loop-hole” - an area outside of Russian and Norwegian economic zone with international regulation. The loop-hole was not covered in 2015-2016, 2018-2019. Left: 2004-2010. Right: 2011-2019.
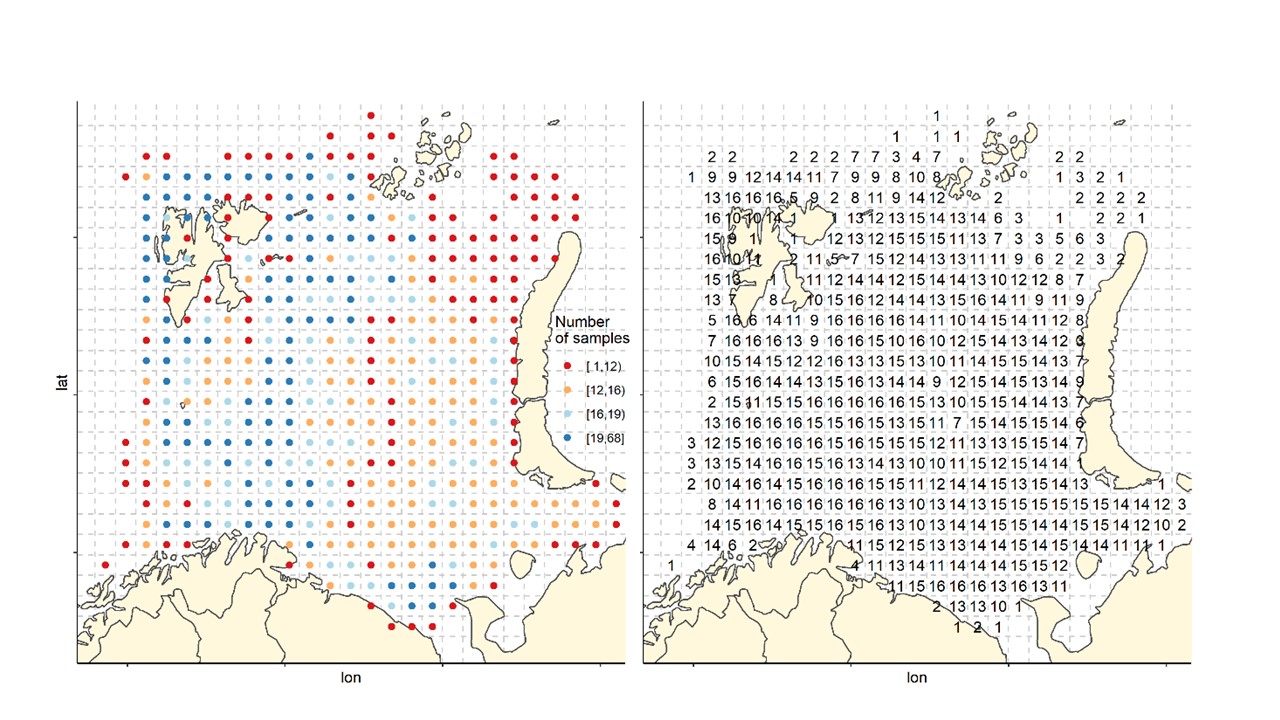
Figure 2. Sampling effort by 35x 35 nm2 grid cells. Left: Total number of stations by grid cells all years (1-68). Right: number of years with at least one station in the grid cell (maximum number of years=16).
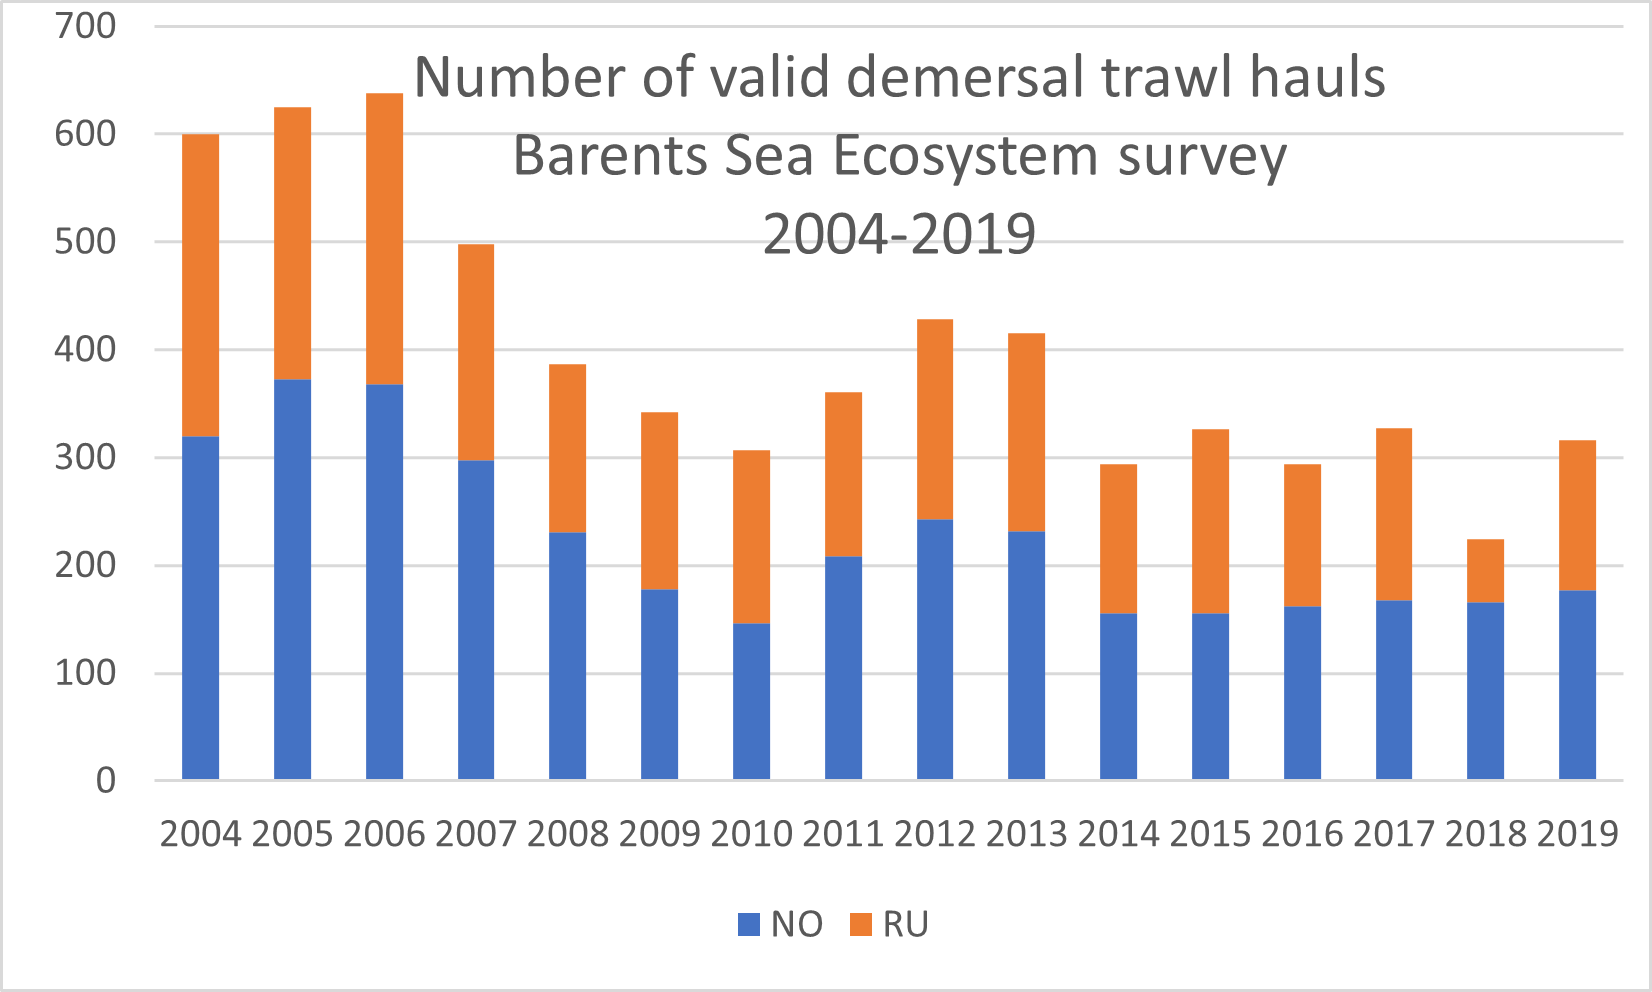
Figure 3. Number of valid demersal trawl hauls Barents Sea Ecosystem survey 2004-2019.
On board the trawl catch is first sorted by species, and then counted and weighed. If the catch is very big only a subsample is sorted and weighed, and then the whole catch is allocated to species based on the ratios in sorted sub-sample. Individuals from all species are length measured, if the catch of a species (or size group of a species) is very large only a sub-sample of max 30 individuals onboard the Norwegian vessels or approximately 50 individuals onboard the Russian is length measured. Since around 2007/2008, the protocol onboard Norwegian vessels has been to look through the unsorted catch to search for and record rare species. Commercial species are in addition weighed individually, sexed, staged and aged.
Around 2007/2008 the focus on correct identification of fish species on board Norwegian vessels was risen and it improved significantly since (see Johannesen et al 2009). This led e.g. to the making of “Atlas for the Barents Sea fishes” that was a joint effort between IMR and PINRO (Wienerroither et al 2011), and the compilation of identification keys for the Barents Sea surveys during dedicated workshops in cooperation between the University Museum of Bergen, IMR and PINRO. Previously, identification keys for more northern and Arctic species have been lacking or incomplete. However, several taxa especially zoarcids and liparids - and also cottids - still pose challenges for correct species identification or have unresolved taxonomic status. Therefore, a procedure for freezing specimens that are difficult to identify (based on taxon or size), or species that lack verified records in the Barents Sea was implemented as standard procedures onboard Norwegian vessels.
2.1.2 - Quality check on land - Norwegian data
Frozen specimens have been verified in the lab and some of them included in the collection of the University Museum of Bergen. The identification was then updated in the data base and coded as verified. In addition, all records by species have been mapped and evaluated, records outside the known distribution area or depth range have been coded as questionable in the data base. These records are tabulated in Appendix 2. Please note that due to several changes in the Norwegian data base and data format since the onset of the survey, codes for some records may have been lost, so the list in appendix is incomplete. The plan is to continue the procedures (freezing, checking frozen specimens in the lab, and mapping and evaluating the catches) implemented to increase data quality in the foreseeable future.
2.2 - Barents Sea Fish Reference List overview
We decided early on when working with the fish diversity data not to reclassify the species We decided early on when working with the fish diversity data not to reclassify the species identification of any of the fish records stored in the raw data unless the specimen was kept and later re-examined and re-classified by an expert.
The identified (likely) misclassifications are dealt with when using the Barents Sea Fish Reference List to “translate” the fish names in the raw data into the fish names in the fish diversity data sets. The fish diversity data sets thereby are only allowed to include species/groups found in Table 1. The fishes in Table 1 are species (in some cases genera of families) recorded at the ecosystem survey that have verified records from the Barents Sea, but does not represent a complete fish species inventory of all species recorded in the Barents Sea (for more comprehensive Barents Sea fish species lists: see e.g. Andriashev and Chernova 1995, Dolgov 2004, 2016, and Appendix 1 in Stiansen and Filin 2008). If new fish species are recorded and verified, the Barents Sea Fish Reference Lis will be updated.
The Barents Sea Fish Reference List was made by extracting all unique Taxonomic Serial Number (TSN, www.itis.gov) of fish from the Barents Sea Ecosystem Survey data (both pelagic and demersal trawls and Norwegian and Russian vessels) in the data base at IMR. The unique fish TSN extracted from the data base were then evaluated based on expert knowledge, and experience over the years working with the data and fishes at the survey and in the lab.
Species recorded in the raw data that have no verified records in the Barents Sea, unresolved taxonomy or known problems with identification, are delt with in three different ways (see e.g. Wienerroither et al 2011 more details):
-
Species “translated” into verified species found in the Barents Sea, examples are Dipturus batis -> Bathyraja spinicauda, Argentina sphyraena -> Argentina silus, Lethenteron japonicum → Lethenteron camtchaticum, Paralepis coregonoides + Paralepididae → Arctozenus risso
-
Species “translated” into genus or family level: Icelus spatula + Icelus bicornis -> Icelus spp., All species records of Ammodytidae -> Ammodytes spp., most likely these are Ammodytes marinu s, all myctophids -> Myctophidae, most of them are Benthosema glaciale , all Gymnelus species -> Gymnelus spp., and all Careproctus species -> Careproctus spp.
-
Species removed: all records at the genus or family level if not found in Table 2, and also a few (recurring erroneously) recorded species not verified from the area: Dipturus oxyrinchus , Leucoraja fullonica , Raja clavata , Coelorinchus caelorhincus , Gaidropsarus ensis , Gaidropsarus vulgaris , Helicolenus dactylopterus
| Order | Family | Scientific | Author |
|---|---|---|---|
| Myxiniformes | Myxinidae | Myxine glutinosa** | Linnaeus 1758 |
| Petromyzontiformes | Petromyzontidae | Lethenteron camtschaticum* | (Tilesius 1811) |
| Petromyzontiformes | Petromyzontidae | Petromyzon marinus* | Linnaeus 1758 |
| Squaliformes | Dalatiidae | Etmopterus spinax** | (Linnaeus 1758) |
| Squaliformes | Somniosidae | Somniosus microcephalus | (Bloch & Schneider 1801) |
| Rajiformes | Arhynchobatidae | Bathyraja spinicauda | (Jensen 1914) |
| Rajiformes | Rajidae | Amblyraja hyperborea | (Collett 1879) |
| Rajiformes | Rajidae | Amblyraja radiata | (Donovan 1808) |
| Rajiformes | Rajidae | Rajella fyllae | (Lütken 1887) |
| Rajiformes | Rajidae | Rajella lintea** | (Fries 1838) |
| Chimaeriformes | Chimaeridae | Chimaera monstrosa** | Linnaeus 1758 |
| Anguilliformes | Synaphobranchidae | Diastobranchus capensis** | Barnard 1923 |
| Clupeiformes | Clupeidae | Clupea harengus | Linnaeus 1758 |
| Clupeiformes | Clupeidae | Clupea pallasii* | Rabinerson 1927 |
| Osmeriformes | Argentinidae | Argentina silus | (Ascanius 1775) |
| Osmeriformes | Microstomatidae | Nansenia groenlandica** | (Reinhardt 1840) |
| Osmeriformes | Alepocephalidae | Xenodermichthys copei | (Gill 1884) |
| Osmeriformes | Osmeridae | Mallotus villosus | (Müller 1776) |
| Osmeriformes | Osmeridae | Osmerus mordax dentex* | Steindachner & Kner 1870 |
| Salmoniformes | Salmonidae | Oncorhynchus gorbuscha | (Walbaum 1792) |
| Salmoniformes | Salmonidae | Salmo salar** | Linnaeus 1758 |
| Stomiiformes | Sternoptychidae | Maurolicus muelleri | (Gmelin 1789) |
| Stomiiformes | Sternoptychidae | Sternoptychidae | |
| Aulopiformes | Paralepididae | Arctozenus risso | (Bonaparte 1840) |
| Myctophiformes | Myctophidae | Myctophidae | |
| Lampriformes | Trachipteridae | Trachipterus arcticus | (Brünnich 1788) |
| Gadiformes | Macrouridae | Coelorinchus labiatus** | (Köhler 1896) |
| Gadiformes | Macrouridae | Coryphaenoides rupestris** | Gunnerus 1765 |
| Gadiformes | Macrouridae | Macrourus berglax | Lacepède 1801 |
| Gadiformes | Gadidae | Arctogadus glacialis | (Peters 1872) |
| Gadiformes | Gadidae | Boreogadus saida | (Lepechin 1774) |
| Gadiformes | Gadidae | Eleginus nawaga* | (Walbaum 1792) |
| Gadiformes | Gadidae | Gadiculus argenteus | Guichenot 1850 |
| Gadiformes | Gadidae | Gadus chalcogrammus** | Pallas 1814 |
| Gadiformes | Gadidae | Gadus morhua | Linnaeus 1758 |
| Gadiformes | Gadidae | Melanogrammus aeglefinus | (Linnaeus 1758) |
| Gadiformes | Gadidae | Merlangius merlangus | (Linnaeus 1758) |
| Gadiformes | Gadidae | Micromesistius poutassou | (Risso 1827) |
| Gadiformes | Gadidae | Pollachius pollachius** | (Linnaeus 1758) |
| Gadiformes | Gadidae | Pollachius virens | (Linnaeus 1758) |
| Gadiformes | Gadidae | Trisopterus esmarkii | (Nilsson 1855) |
| Gadiformes | Gadidae | Trisopterus minutus** | (Linnaeus 1758) |
| Gadiformes | Lotidae | Brosme brosme | (Ascanius 1772) |
| Gadiformes | Lotidae | Ciliata mustela | (Linnaeus 1758) |
| Gadiformes | Lotidae | Ciliata septentrionalis | (Collett 1875) |
| Gadiformes | Lotidae | Enchelyopus cimbrius | (Linnaeus 1766) |
| Gadiformes | Lotidae | Gaidropsarus argentatus | (Reinhardt 1837) |
| Gadiformes | Lotidae | Molva dypterygia** | (Pennant 1784) |
| Gadiformes | Lotidae | Molva molva** | (Linnaeus 1758) |
| Gadiformes | Phycidae | Phycis blennoides** | (Brünnich 1768) |
| Gadiformes | Merlucciidae | Merluccius merluccius** | (Linnaeus 1758) |
| Ophidiiformes | Carapidae | Echiodon drummondii | Thompson 1837 |
| Lophiiformes | Lophiidae | Lophius piscatorius** | Linnaeus 1758 |
| Beloniformes | Belonidae | Belone belone | (Linnaeus 1760) |
| Gasterosteiformes | Gasterosteidae | Gasterosteus aculeatus | Linnaeus 1758 |
| Gasterosteiformes | Gasterosteidae | Pungitius pungitius* | (Linnaeus 1758) |
| Syngnathiformes | Syngnathidae | Syngnathidae | |
| Scorpaeniformes | Scorpaenidae | Sebastes mentella | Travin 1951 |
| Scorpaeniformes | Scorpaenidae | Sebastes norvegicus | (Ascanius 1772) |
| Scorpaeniformes | Scorpaenidae | Sebastes viviparus | Krøyer 1845 |
| Scorpaeniformes | Scorpaenidae | Sebastes spp | |
| Scorpaeniformes | Triglidae | Eutrigla gurnardus** | (Linnaeus 1758) |
| Scorpaeniformes | Cottidae | Artediellus atlanticus | Jordan & Evermann 1898 |
| Scorpaeniformes | Cottidae | Artediellus scaber* | Knipowitsch 1907 |
| Scorpaeniformes | Cottidae | Gymnocanthus tricuspis | (Reinhardt 1830) |
| Scorpaeniformes | Cottidae | Icelus spp | |
| Scorpaeniformes | Cottidae | Myoxocephalus quadricornis | (Linnaeus 1758) |
| Scorpaeniformes | Cottidae | Myoxocephalus scorpius | (Mitchell 1814) |
| Scorpaeniformes | Cottidae | Triglops murrayi | Günther 1888 |
| Scorpaeniformes | Cottidae | Triglops nybelini | Jensen 1944 |
| Scorpaeniformes | Cottidae | Triglops pingelii | Reinhardt 1837 |
| Scorpaeniformes | Psychrolutidae | Cottunculus microps | Collett 1875 |
| Scorpaeniformes | Agonidae | Agonus cataphractus* | (Linnaeus 1758) |
| Scorpaeniformes | Agonidae | Aspidophoroides olrikii | Lütken 1877 |
| Scorpaeniformes | Agonidae | Leptagonus decagonus | (Bloch & Schneider 1801) |
| Scorpaeniformes | Cyclopteridae | Cyclopteropsis macalpini** | (Fowler 1914) |
| Scorpaeniformes | Cyclopteridae | Cyclopterus lumpus | Linnaeus 1758 |
| Scorpaeniformes | Cyclopteridae | Eumicrotremus derjugini | Popov 1926 |
| Scorpaeniformes | Cyclopteridae | Eumicrotremus spinosus | (Fabricius 1776) |
| Scorpaeniformes | Liparidae | Careproctus spp | |
| Scorpaeniformes | Liparidae | Liparis bathyarcticus | Parr 1931 |
| Scorpaeniformes | Liparidae | Liparis fabricii | Krøyer 1847 |
| Scorpaeniformes | Liparidae | Liparis liparis | (Linnaeus 1766) |
| Scorpaeniformes | Liparidae | Liparis montagui | (Donovan 1804) |
| Scorpaeniformes | Liparidae | Liparis tunicatus | Reinhardt 1836 |
| Scorpaeniformes | Liparidae | Paraliparis bathybius | (Collett 1879) |
| Scorpaeniformes | Liparidae | Rhodichthys regina | Collett 1879 |
| Scorpaeniformes | Liparidae | Liparidae | |
| Perciformes | Carangidae | Trachurus trachurus | (Linnaeus 1758) |
| Perciformes | Zoarcidae | Gymnelus spp | |
| Perciformes | Zoarcidae | Lycenchelys kolthoffi | Jensen 1904 |
| Perciformes | Zoarcidae | Lycenchelys muraena | (Collett 1878) |
| Perciformes | Zoarcidae | Lycenchelys sarsii | (Collett 1871) |
| Perciformes | Zoarcidae | Lycodes adolfi** | Nielsen & Fosså 1993 |
| Perciformes | Zoarcidae | Lycodes esmarkii | Collett 1875 |
| Perciformes | Zoarcidae | Lycodes eudipleurostictus | Jensen 1902 |
| Perciformes | Zoarcidae | Lycodes frigidus** | Collett 1879 |
| Perciformes | Zoarcidae | Lycodes gracilis | Sars 1867 |
| Perciformes | Zoarcidae | Lycodes luetkenii | Collett 1880 |
| Perciformes | Zoarcidae | Lycodes paamiuti** | Møller 2001 |
| Perciformes | Zoarcidae | Lycodes pallidus | Collett 1879 |
| Perciformes | Zoarcidae | Lycodes polaris | (Sabine 1824) |
| Perciformes | Zoarcidae | Lycodes reticulatus | Reinhardt 1835 |
| Perciformes | Zoarcidae | Lycodes rossi | Malmgren 1865 |
| Perciformes | Zoarcidae | Lycodes seminudus | Reinhardt 1837 |
| Perciformes | Zoarcidae | Lycodes squamiventer | Jensen 1904 |
| Perciformes | Zoarcidae | Lycodonus flagellicauda | (Jensen 1902) |
| Perciformes | Zoarcidae | Zoarcidae | |
| Perciformes | Stichaeidae | Anisarchus medius | (Reinhardt 1837) |
| Perciformes | Stichaeidae | Leptoclinus maculatus | (Fries 1838) |
| Perciformes | Stichaeidae | Lumpenus fabricii* | Reinhardt 1836 |
| Perciformes | Stichaeidae | Lumpenus lampretaeformis | (Walbaum 1792) |
| Perciformes | Pholidae | Pholis gunnellus | (Linnaeus 1758) |
| Perciformes | Anarhichadidae | Anarhichas denticulatus | Krøyer 1845 |
| Perciformes | Anarhichadidae | Anarhichas lupus | Linnaeus 1758 |
| Perciformes | Anarhichadidae | Anarhichas minor | Olafsen 1772 |
| Perciformes | Ammodytidae | Ammodytes spp | |
| Perciformes | Scombridae | Scomber scombrus | Linnaeus 1758 |
| Perciformes | Centrolophidae | Centrolophus niger | (Gmelin 1789) |
| Perciformes | Centrolophidae | Schedophilus medusophagus | (Cocco 1839) |
| Pleuronectiformes | Scophthalmidae | Lepidorhombus boscii | (Risso 1810) |
| Pleuronectiformes | Scophthalmidae | Lepidorhombus whiffiagonis** | (Walbaum 1792) |
| Pleuronectiformes | Scophthalmidae | Zeugopterus norvegicus** | (Günther 1862) |
| Pleuronectiformes | Pleuronectidae | Glyptocephalus cynoglossus | (Linnaeus 1758) |
| Pleuronectiformes | Pleuronectidae | Hippoglossoides platessoides | (Fabricius 1780) |
| Pleuronectiformes | Pleuronectidae | Hippoglossus hippoglossus** | (Linnaeus 1758) |
| Pleuronectiformes | Pleuronectidae | Limanda limanda | (Linnaeus 1758) |
| Pleuronectiformes | Pleuronectidae | Liopsetta glacialis* | (Pallas 1776) |
| Pleuronectiformes | Pleuronectidae | Microstomus kitt | (Walbaum 1792) |
| Pleuronectiformes | Pleuronectidae | Platichthys flesus | (Linnaeus 1758) |
| Pleuronectiformes | Pleuronectidae | Pleuronectes platessa | Linnaeus 1758 |
| Pleuronectiformes | Pleuronectidae | Reinhardtius hippoglossoides | (Walbaum 1792) |
There are some cases of likely misidentifications that are not dealt with by using the Barents Sea Fish Reference List . These are listed in Appendix 2 and are records of species verified for the Barents Sea, but outliers in terms the normal depth range, distribution area within the Barents Sea, size etc. These should be removed before analysing the data (see 2.3.5)
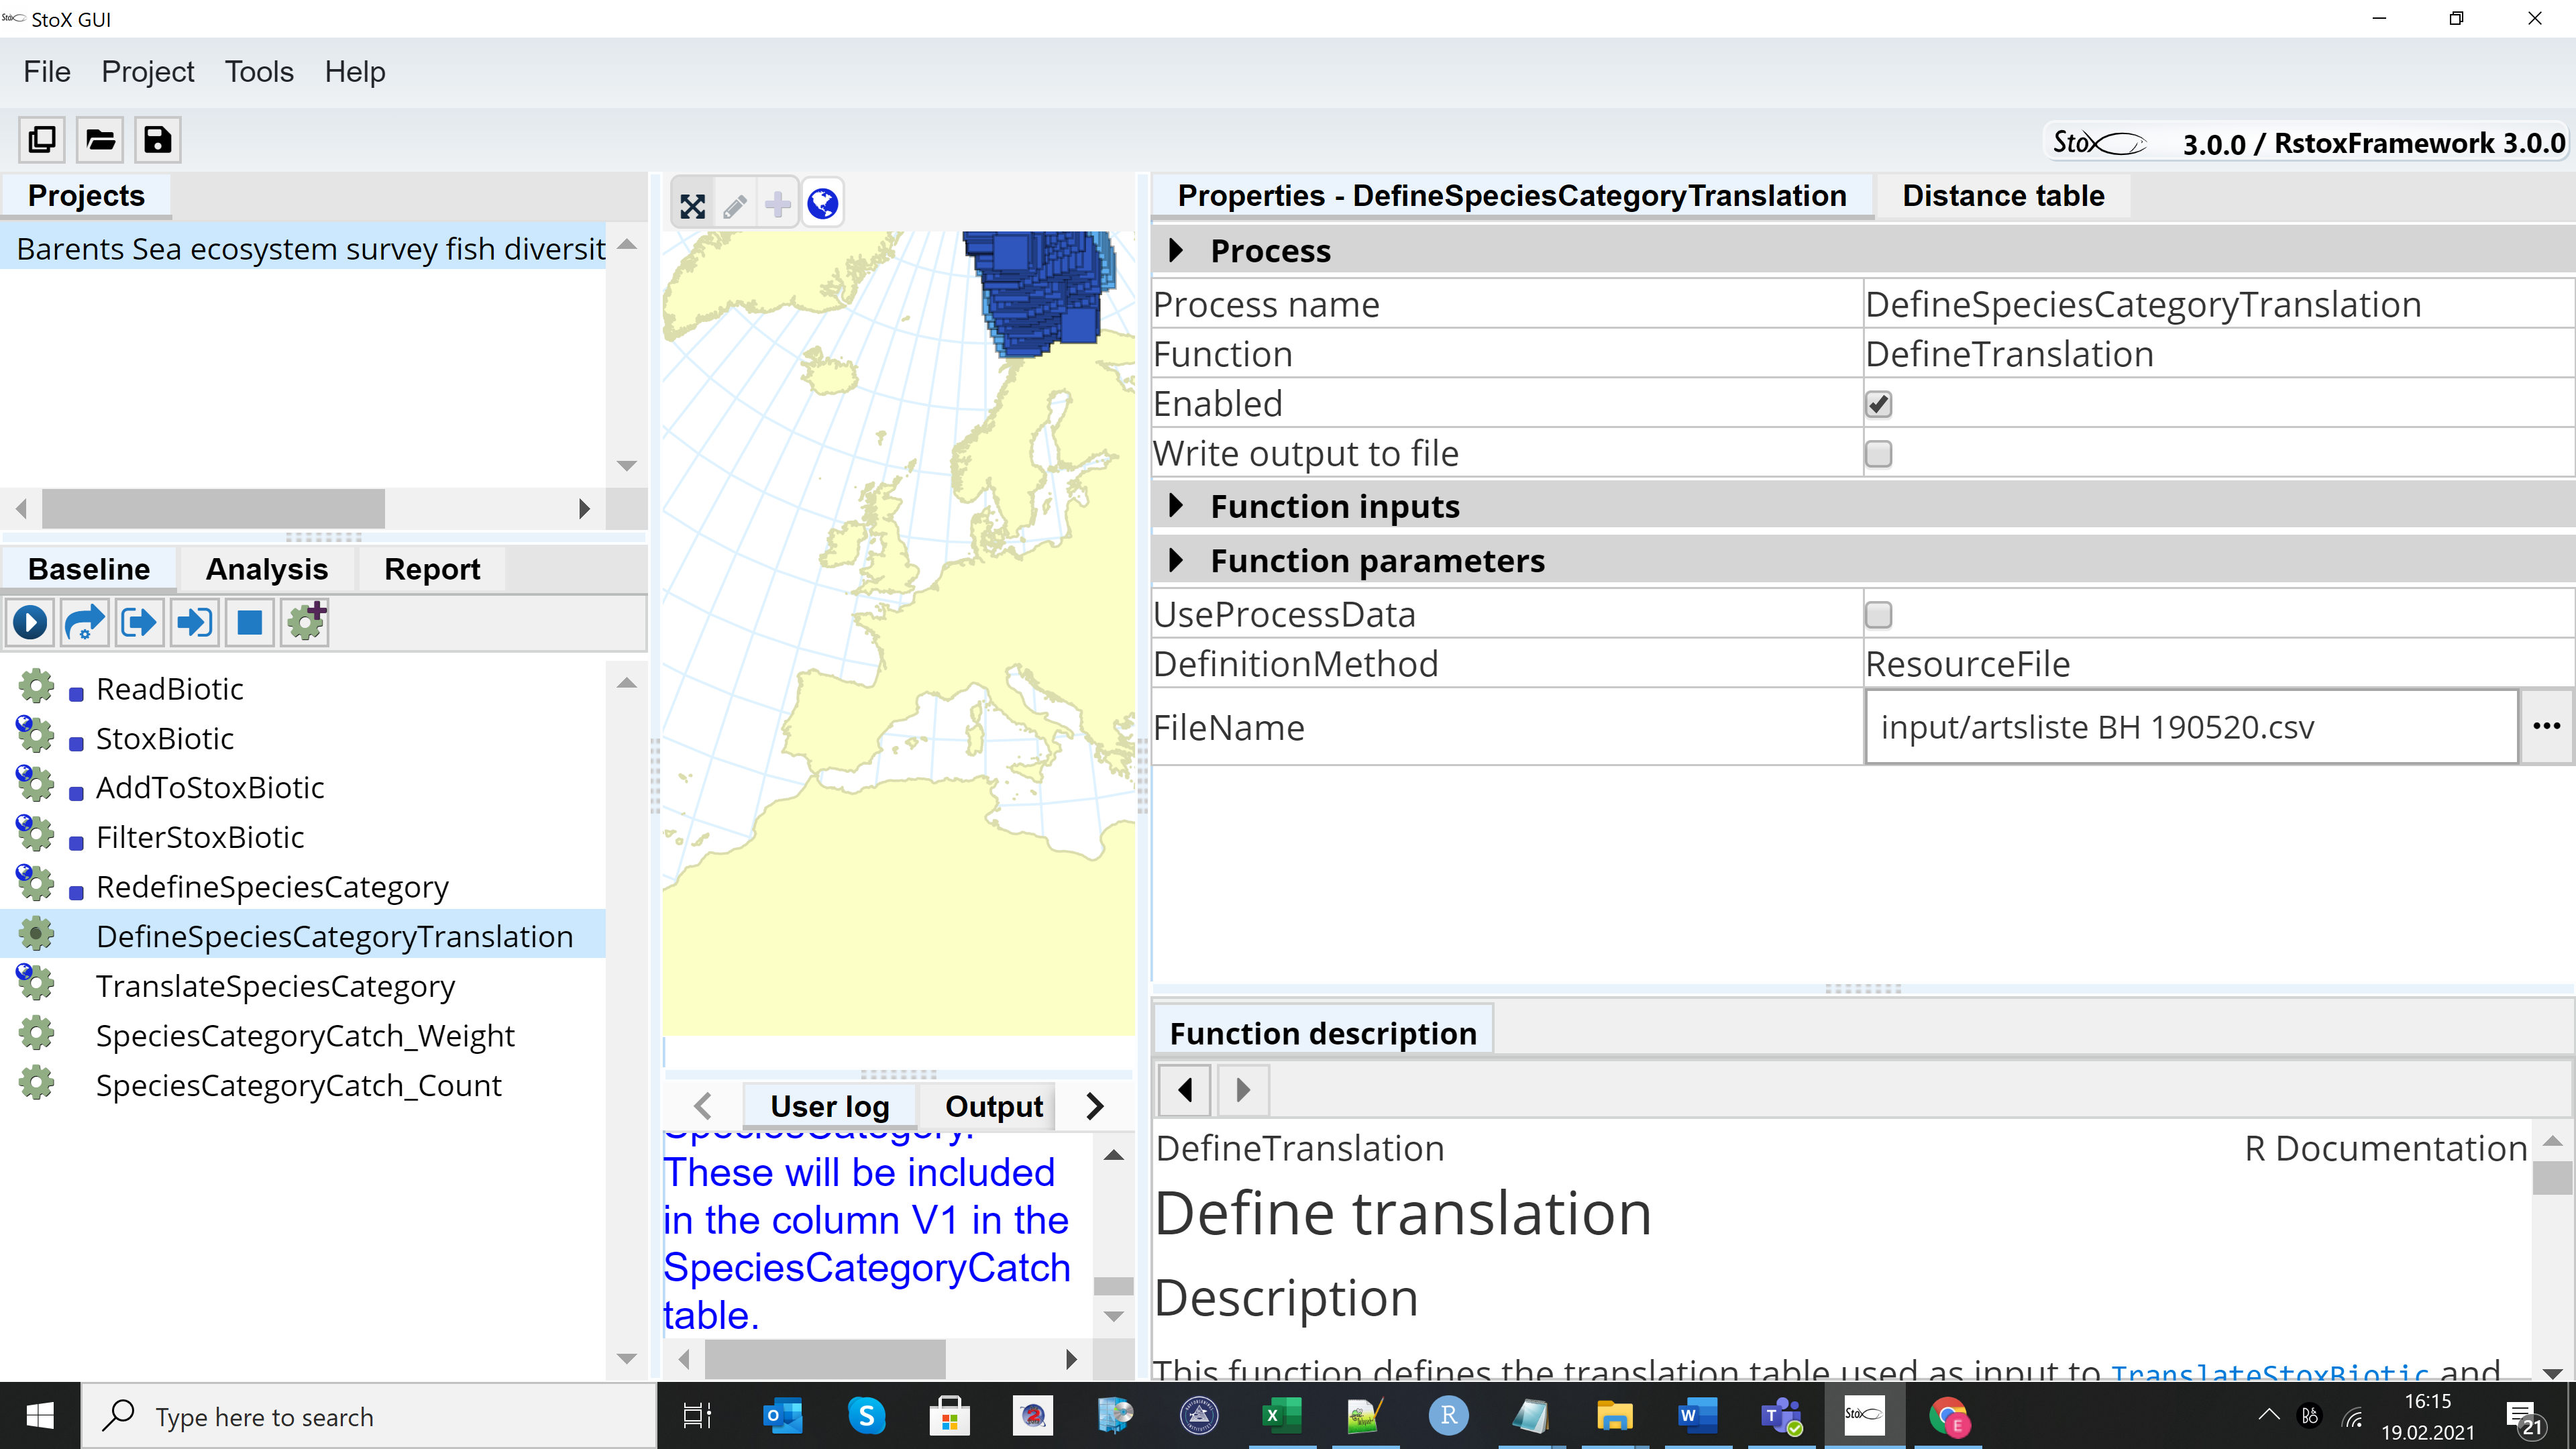
2.2.1 - Running example project StoX 3.0
The example project “Barents Sea ecosystem survey fish diversity data export 2019 NO” can be found when downloading StoX 3.0. The project folder contains three main subfolders: “input”, “output” and “process”. Install StoX 3.0 and open it. Project menu in StoX – Open project and select the folder where you have stored the example project. The screen looks like this:
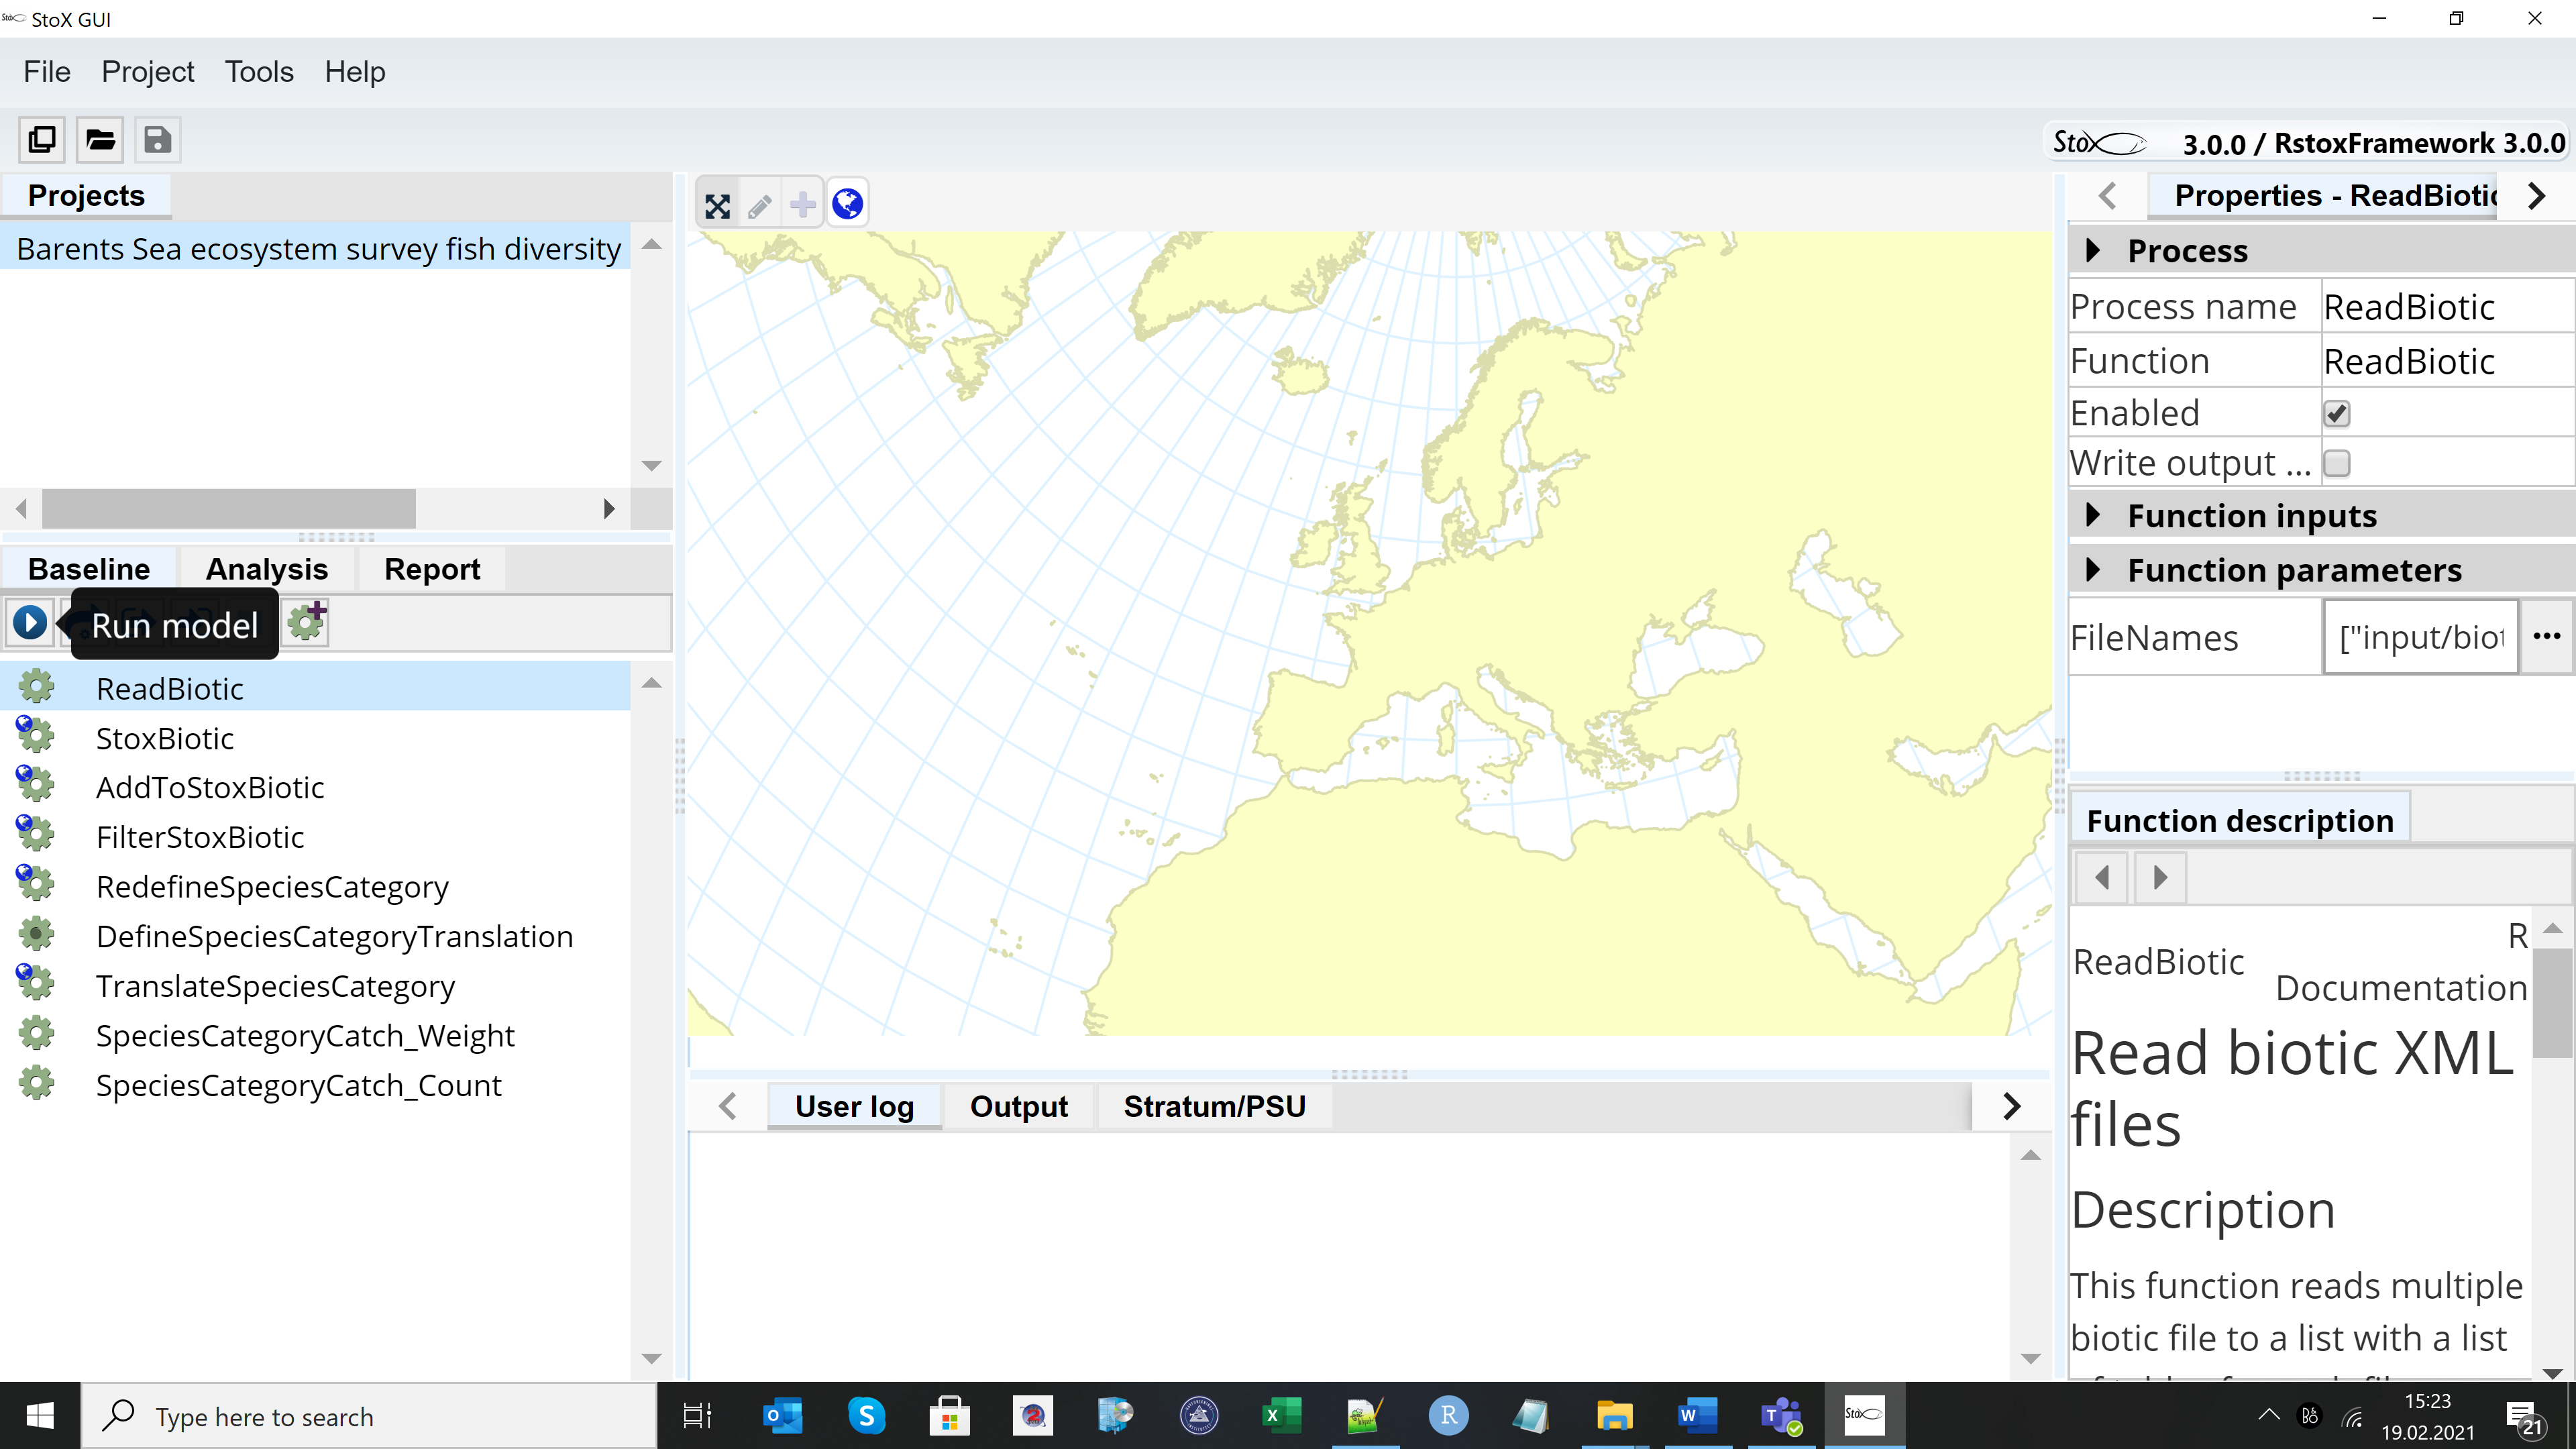
Press the arrow on the Baseline menu and run the model, then go to the Report menu and press the arrow to generate the output.
2.2.2 - The output
The output is found in the output folder, in the subfolder “Report”. In the “Report” subfolder – the catches in count of individuals can be found in the sub-folder: “ReportSpeciesCategoryCatch_Count”, and the catches in weight in kg can be found in sub-folder: “ReportSpeciesCategoryCatch_Weight”. The output files are called “ReportSpeciesCategoryCatch_Count_ReportSpeciesCategoryCatchData.txt”, and “ReportSpeciesCategoryCatch_Weight_ReportSpeciesCategoryCatchData.txt”. The rows in the data sets are the stations, the first 24 columns in the data set are identical for the two output files and gives station information, including “DateTime”, “Latitude”, “Longitude”, “BottomDepth”, the rest of the columns are the species, and the cells entries in these columns are the catches. NB the catches are not standardised and should be standardised into numbers (or kg) by nm towed by dividing by the “TowDistance” in nautical miles. The standard towing distance is 0.75 nautical miles (15 minute tows at speed 3 knots). The column “serialnumber” identifies the station within a year.
2.2.3 - Running StoX with input from a different year
Open StoX, open an old project and save the project changing the year in the project name. Close StoX. Download xml data from https://datasetexplorer.hi.no/apps/datasetexplorer/v2/navigation- this option is only available within IMR. Go to the input folder in the new project and replace the xlm files. Open StoX and select the new xml files before running “ReadBiotic”.
2.2.4 - Running StoX with a new Fish Reference list
The Barents Sea Fish Reference List is downloaded with the input folder when downloading the example project. If an updated reference list is made, e.g. if a new species is added to the list, then the old reference list in the input folder should be replaced with the updated reference list (csv format). Untick the “UseProcessDara” box in the DefineSpeciesCategorryTranslation window and select the new reference file in the FIleName window.
2.2.5 - Recommended adjustments to the output before analysis
Eelpouts and liparids. When combing years, we recommend that all records of eelpouts (Zoarcidae) are pooled to the family level, because they are notoriously difficult to identify (see Appendix 3). The same apply to liparids (Liparidae). If species level data of these families are used, consider excluding data from 2004-2006/2007. These years the staff on some of the Norwegian vessels were inexperienced, and proper identification keys for arctic species were lacking (compare for instance catches of Lycodes frigidus and Lycodes eudipleurostictus in the first years to the later years, Appendix 3). If species level data of these families are used, records to family levels should be removed or else these will be treated as a separate species in the further analysis of the data. Both Zoarcidae and Liparidae have unresolved taxonomy for some genera, therefore we have chosen to pool all liparids of the genus Careproctus and all eelpouts of the genus Gymnelus in the output. Sebastes. The column " Sebastes spp." contains mainly juvenile redfish. Small specimens are very difficult to identify so the protocol is to identify only individuals larger than 10 cm to the species level. Before analysis, all redfish ( S . mentella , S. norvegicus, S. viviparus and Sebastes spp .) should be pooled, or Sebastes spp. should be removed – if not it will be treated as a separate species in the analysis . Records in Appendix 2. The records of the S. viviparus west of Svalbard(Spitsbergen) are unreliable and should be removed if Sebastes data are kept at the species level (Appendix 2). Species verified for the Barents Sea, but outliers in terms the normal depth range, distribution area within the Barents Sea, size etc. were coded as questionable in the data base (Appendix 2) and should be removed before analysis. Consider also removing pelagic species (e.g. capelin and herring), as these are poorly sampled by the bottom trawl. The data should be standardised with towing distance before analysis.
2.3 - Running the StoX model for other regions
The Barents Sea Fish Reference List and filters in the example project is tailored to the Barents Sea surveys, but the example project could be modified and used for different regions by creating region specific fish references list at the format Barents Sea Fish Reference List. Furthermore, station filters must be modified as the gear codes vary be regions.
3 - Results on main patterns in fish diversity and dominance
3.1 - Abundance, biomass and occupancy relationships
Averaged over the years, the five most abundant species according to biomass were cod (Gadus morhua), haddock (Melanogrammus aeglefinus), long rough dab (Hippoglossoides platessoides), deepwater redfish (Sebastes mentella) and polar cod (Boreogadus saida), in that order. The five most abundant according to the number of individuals were polar cod, capelin (Mallotus villosus) , long rough dab, cod and blue whiting (Micromesistius poutassou) in the order listed. The ranking, however, varied by year. Abundance and biomass (Figure 4a) and average occupancy and abundance (Figure 4b) were positively correlated. The fifteen species with the average highest catch rates constituted over 95% of the catches in terms of abundance and biomass (Figure 4c). About half of the species were caught in >2% of the stations and all these were caught every year (Figure 4d).
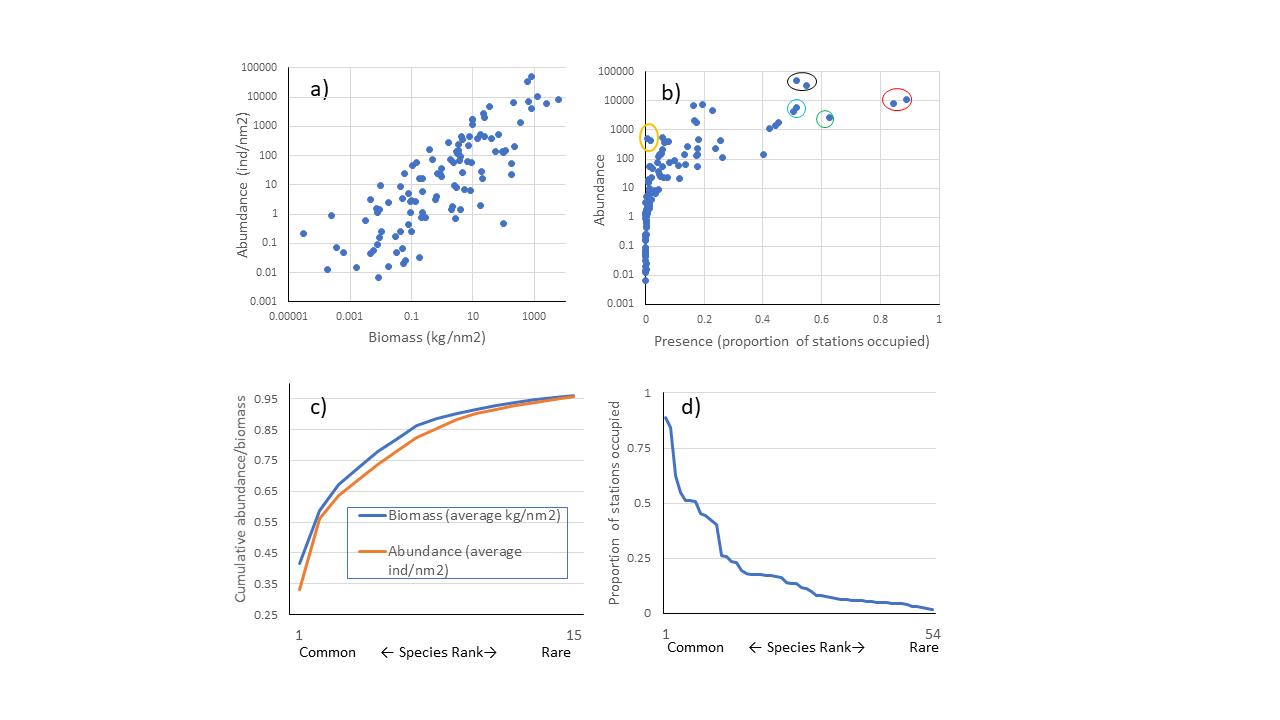
Figure 4 a) Abundance (individuals per nm2) against biomass (kg per nm2), averaged across stations within each year and then averaged over all years, each point is a species/taxonomic group. b) Abundance (individuals per nm2) against proportion of stations occupied by a species, averaged over all years, each point is a species/taхonomic group. Seven species were found on average in more than 50% of the stations: long rough dab and cod (circled in red), Atlantic hook-ear sculpin (Artediellus atlanticus) (circled in green), capelin and polar cod (circled in black), and haddock and deep-water redfish (circled in turquoise). Navaga (Eleginus nawaga), and Pacific herring (Clupea pallasii) (yellow circles) were found in high densities in only a few stations. c) Cumulative proportion of biomass and abundance plotted against species rank, common to rare, only the 15 most common species are shown, they constitute on average more than 95% of the total biomass and abundance of species combined. d) Proportion of stations occupied by a species in a year, averaged over the 16 years of investigation, plotted against species rank from common to rare, the 54 most common species area shown, all of these are found in> 2% of the stations.
Seven species were found on average in more than 50% of the stations: long rough dab and cod, Atlantic hook-ear sculpin (Artediellus atlanticus), capelin, polar cod, and haddock and deep-water redfish (Figure 4b). Some species are found in high density in only a few stations. Eхamples are navaga (Eleginus nawaga), and Pacific herring (Clupea pallasii), found only in south-eastern part of the covered area. Eхamples of species found at the border of the surveyed area are several species of eelpouts that are found along the shelf break towards the polar basin in cold and deep waters: Lycenchelys kolthoffi, L. muraena, Lycodes adolfi, L. frigidus, L. luetkenii, L. paamiuti, L. squamiventer, Lycodenus flagellicauda (see also Appendix 3, and Johannesen et al 2017a).
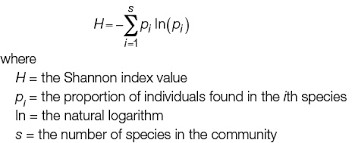
3.2 - Species diversity
The Shannon index is a commonly used diversity index combining the number of species and their relative dominance in one index:
Overall, the fish species richness (number of species per station) and the Shannon index was lower in the eastern Barents Sea (Figure 5), see also Johannesen et al 2012), this was more or less consistent over the years (Figure 6 and 7). The Shannon index varied more between years than Species richness (Figure 6 and 7).
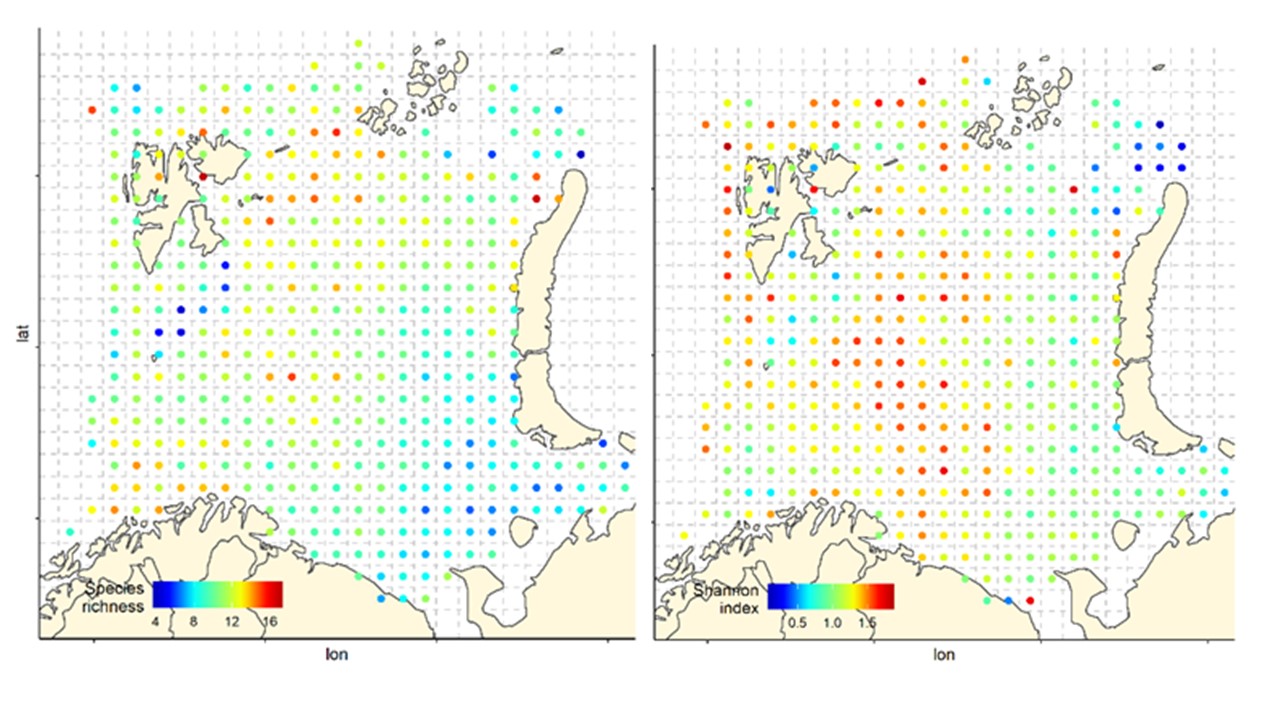
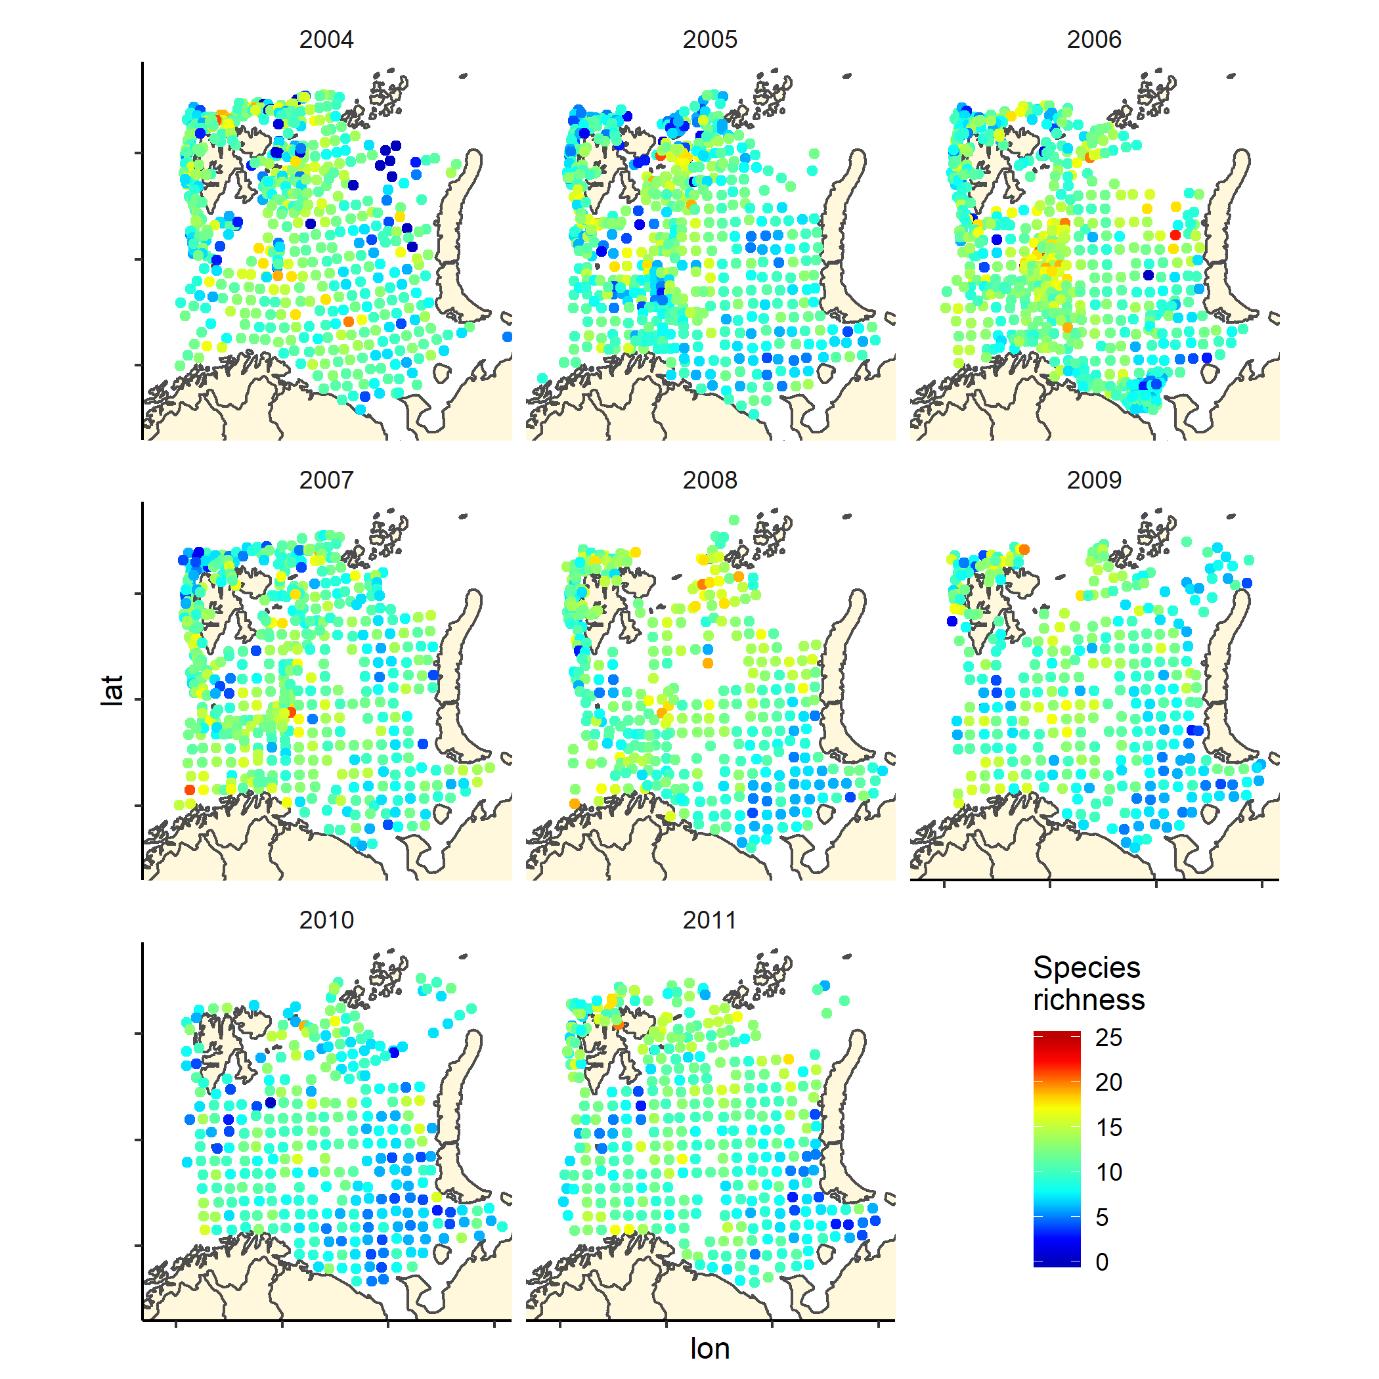
Figure 6. Species richness measured as the number of fish species recorded by 35 nm by 35 nm grid cells by year. Note that the scale varies: 0-25 in 2004-2011, and 0-20 in 2012-2019.
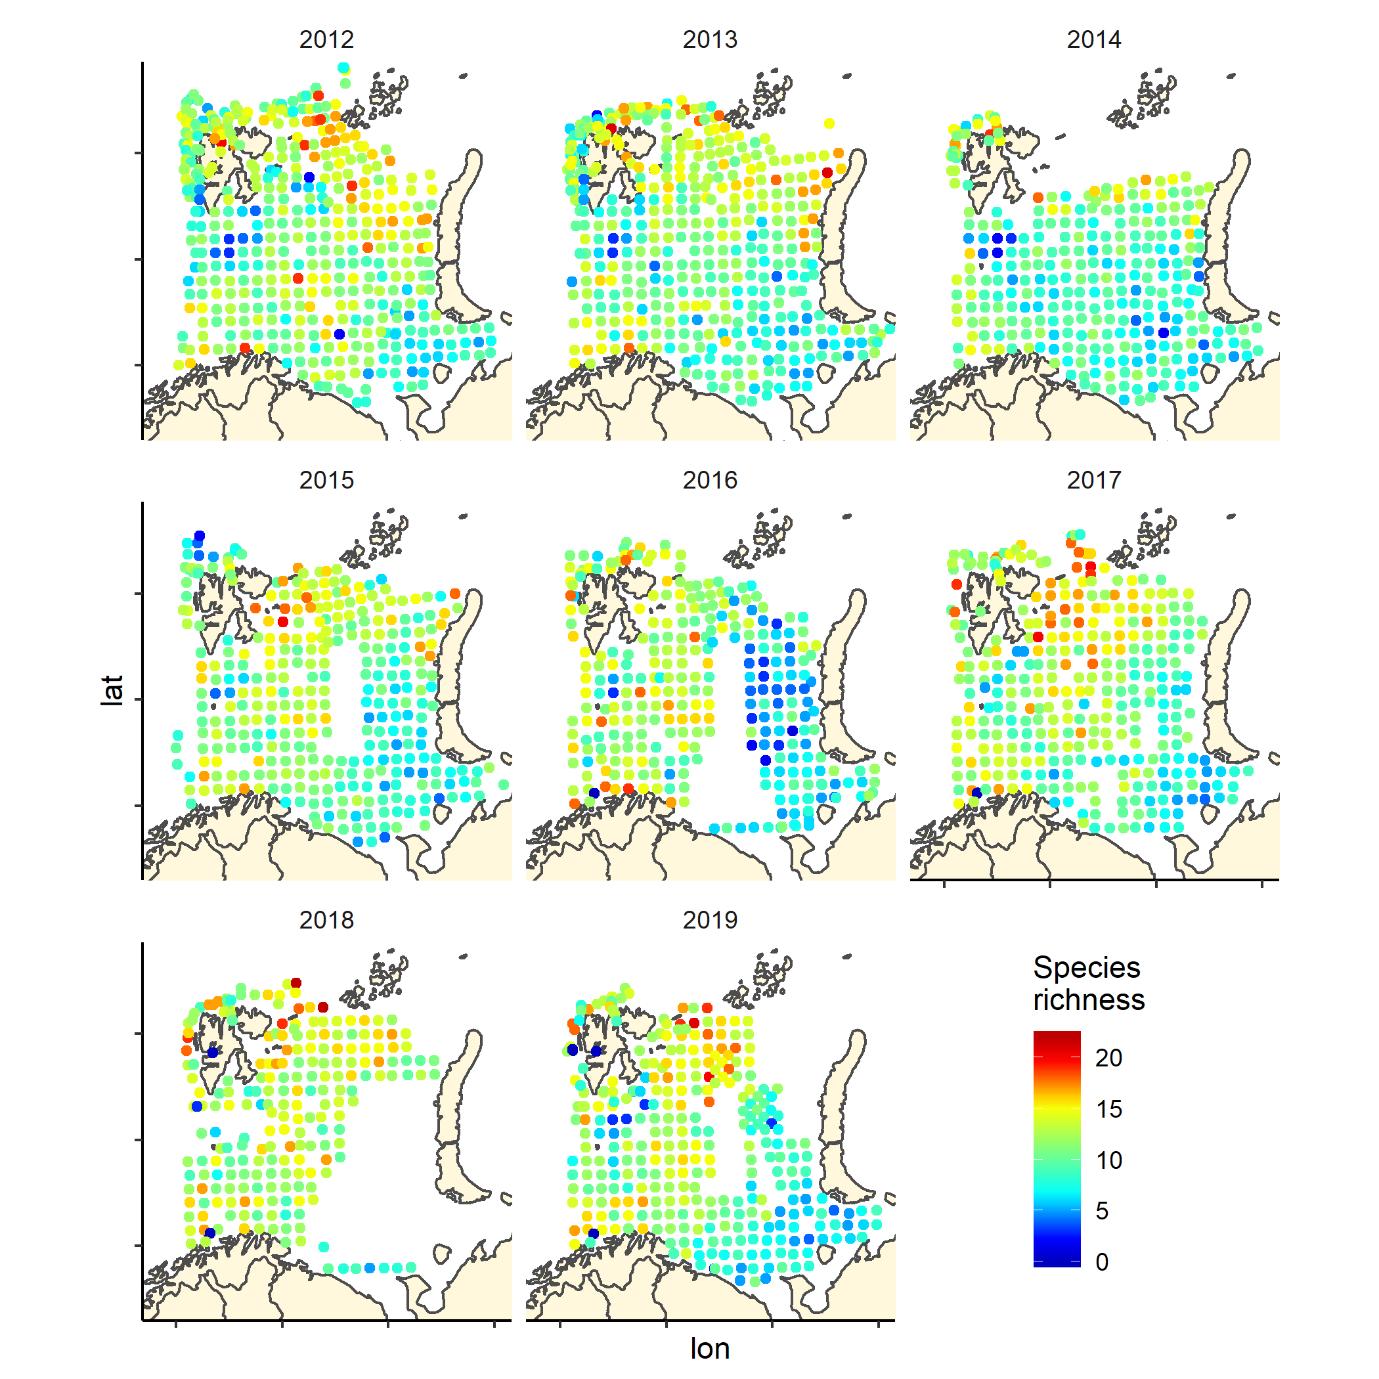
Figure 6 (continued). Species richness measured as the number of fish species recorded by 35 nm by 35 nm grid cells by year. Note that the scale varies: 0-25 in 2004-2011, and 0-20 in 2012-2019.
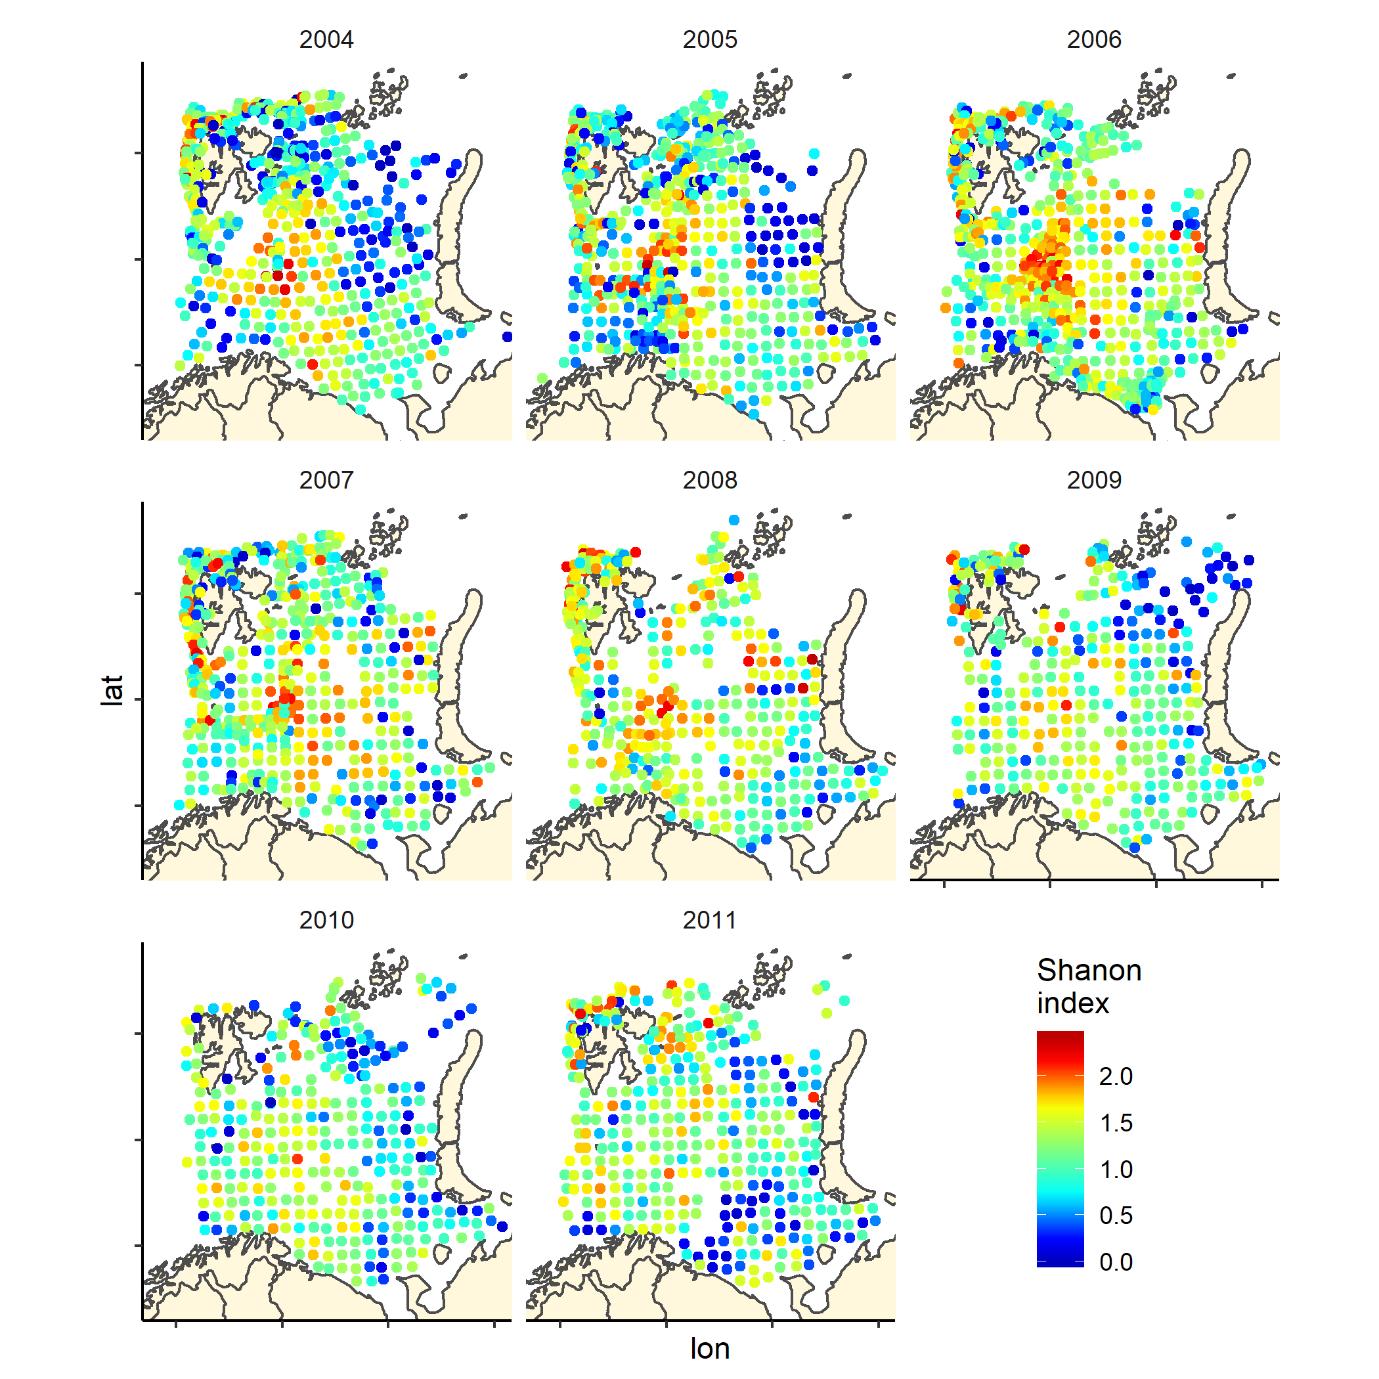
Figure 7. Shannon index of diversity by 35 nm by 35 nm grid cells by year
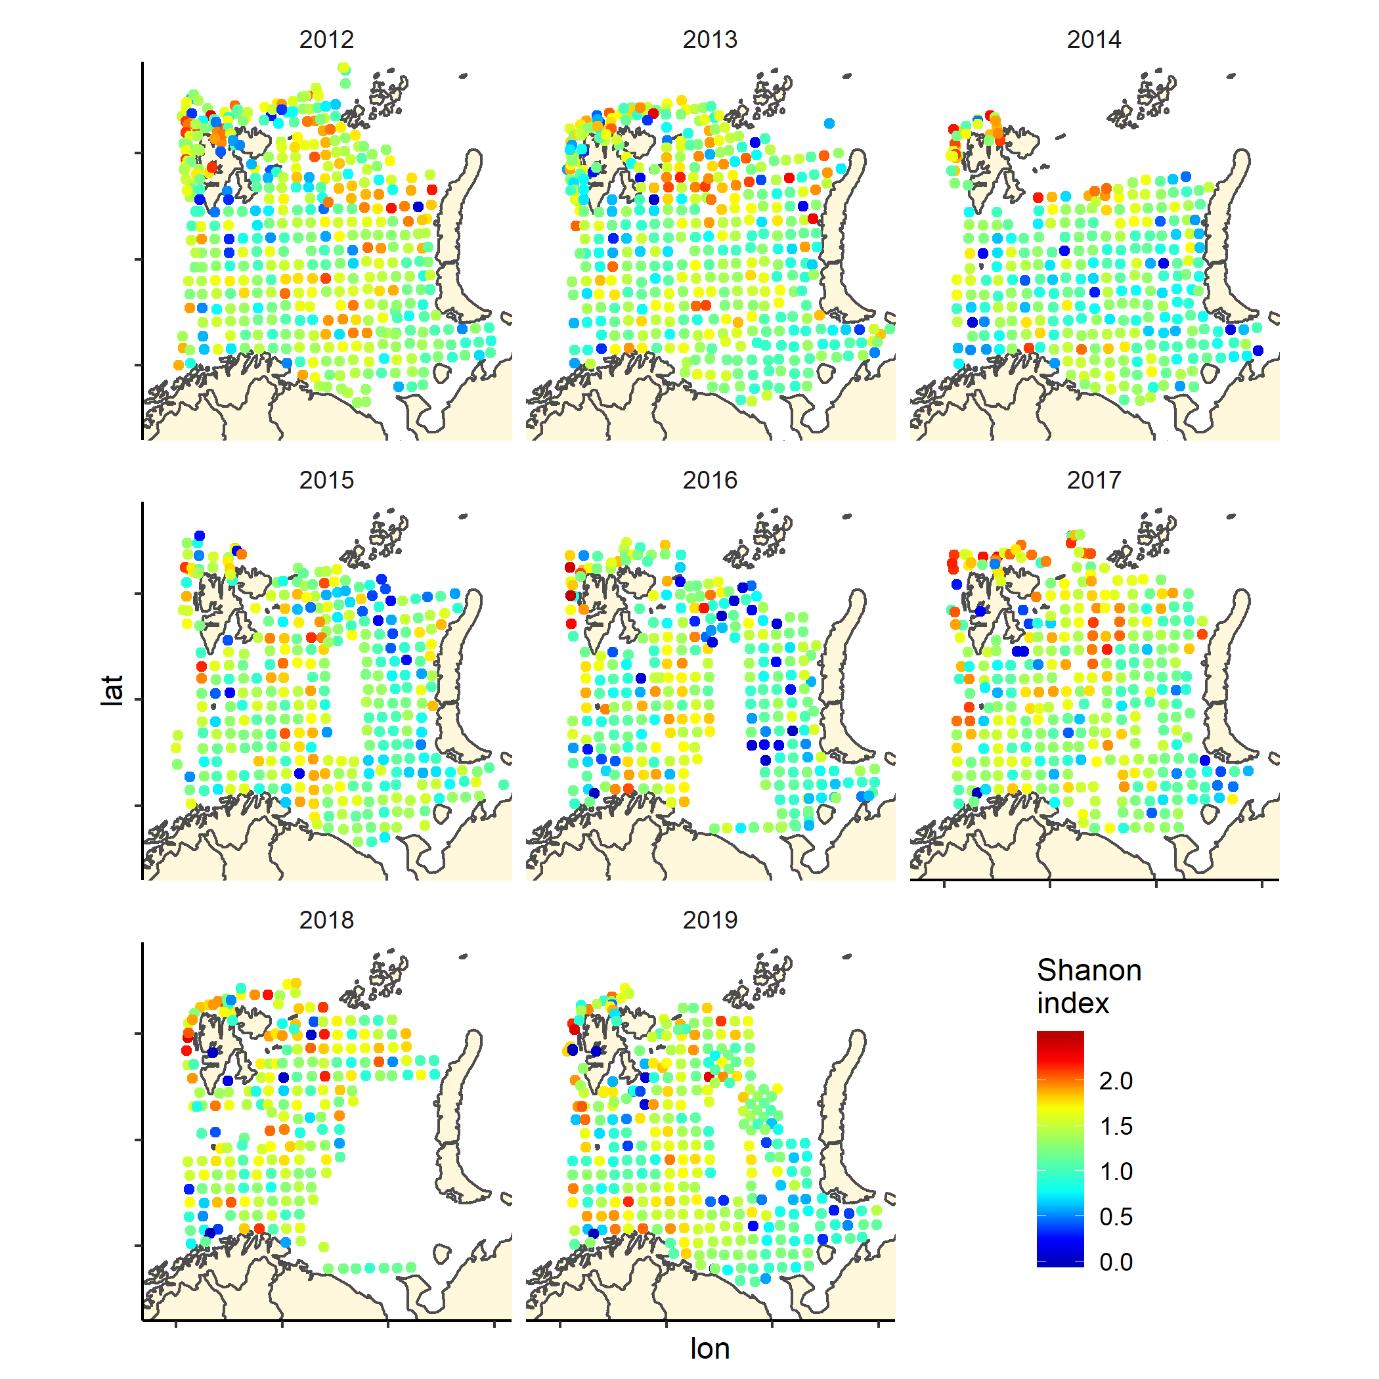
Figure 7 (continued). Shannon index of diversity by 35 nm by 35 nm grid cells by year
3.3 - Main gradients in species composition
We run a Correspondence Analyses (package CA in R) on the data after transforming to presence absence. This is a very strong transformation that removes the variation in relative abundance. The main gradient (CA1) in species composition was a south-west (Atlantic) to north-east (Arctic) gradient (Figure 8) that was fairly consistent across years. The second gradient was a depth gradient, but this gradient was not so obvious in some years, especially in the most recent years (Figure 9). The same two main gradients were found for fish and benthos in Johannesen et al (2017b).
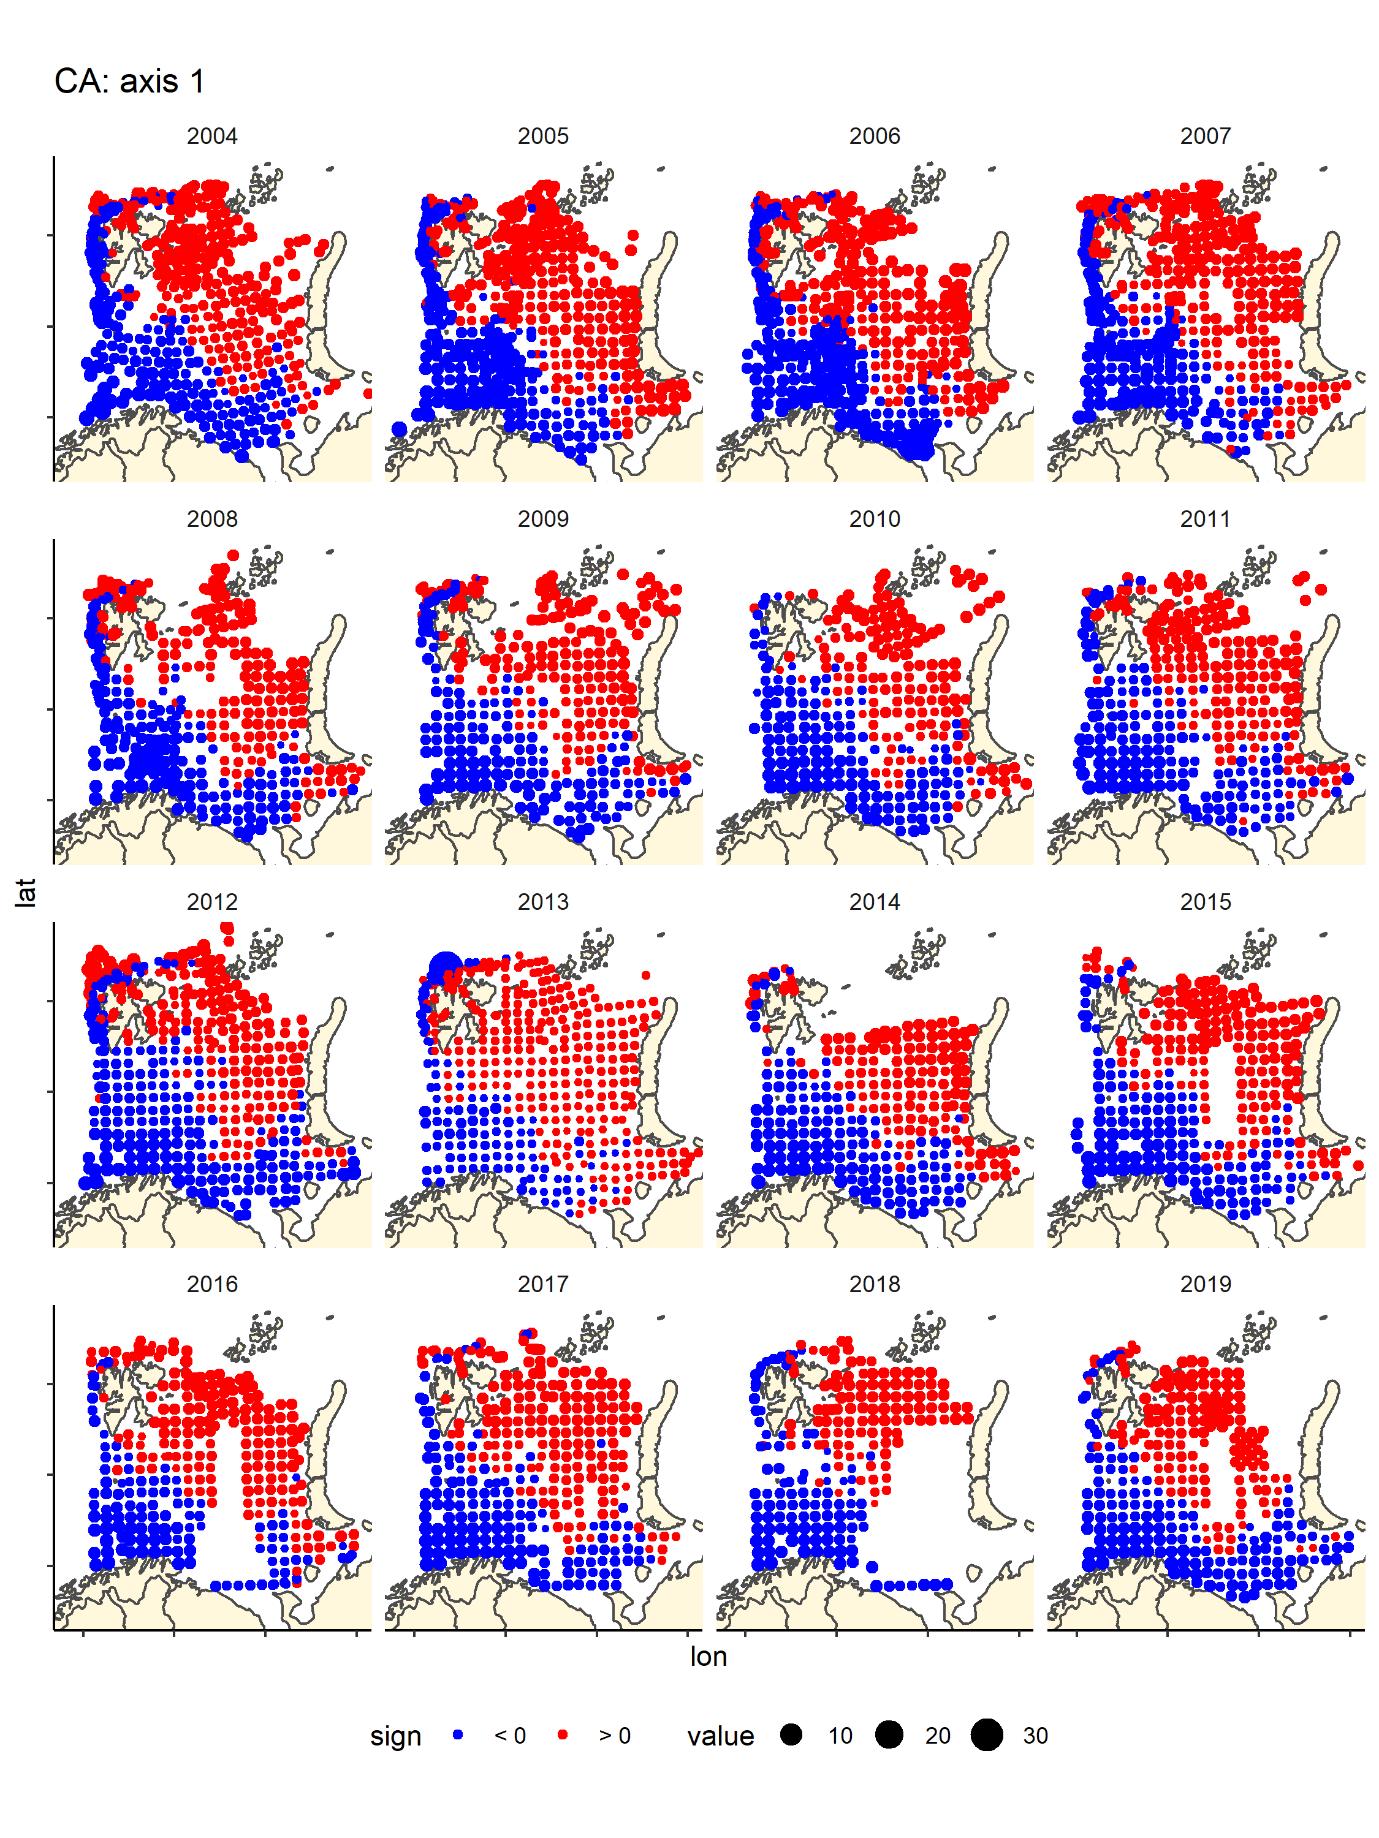
Figure 8 CA1 score by bottom trawl station, presence - absence fish data by year, showing the main gradient from boreal-warmer water species in the Barents Sea dominated by warmer Atlantic waters (south and west of Svalbard) blue and cold water species found in the north—northeast typically covered with covered during winter and with low temperatures.
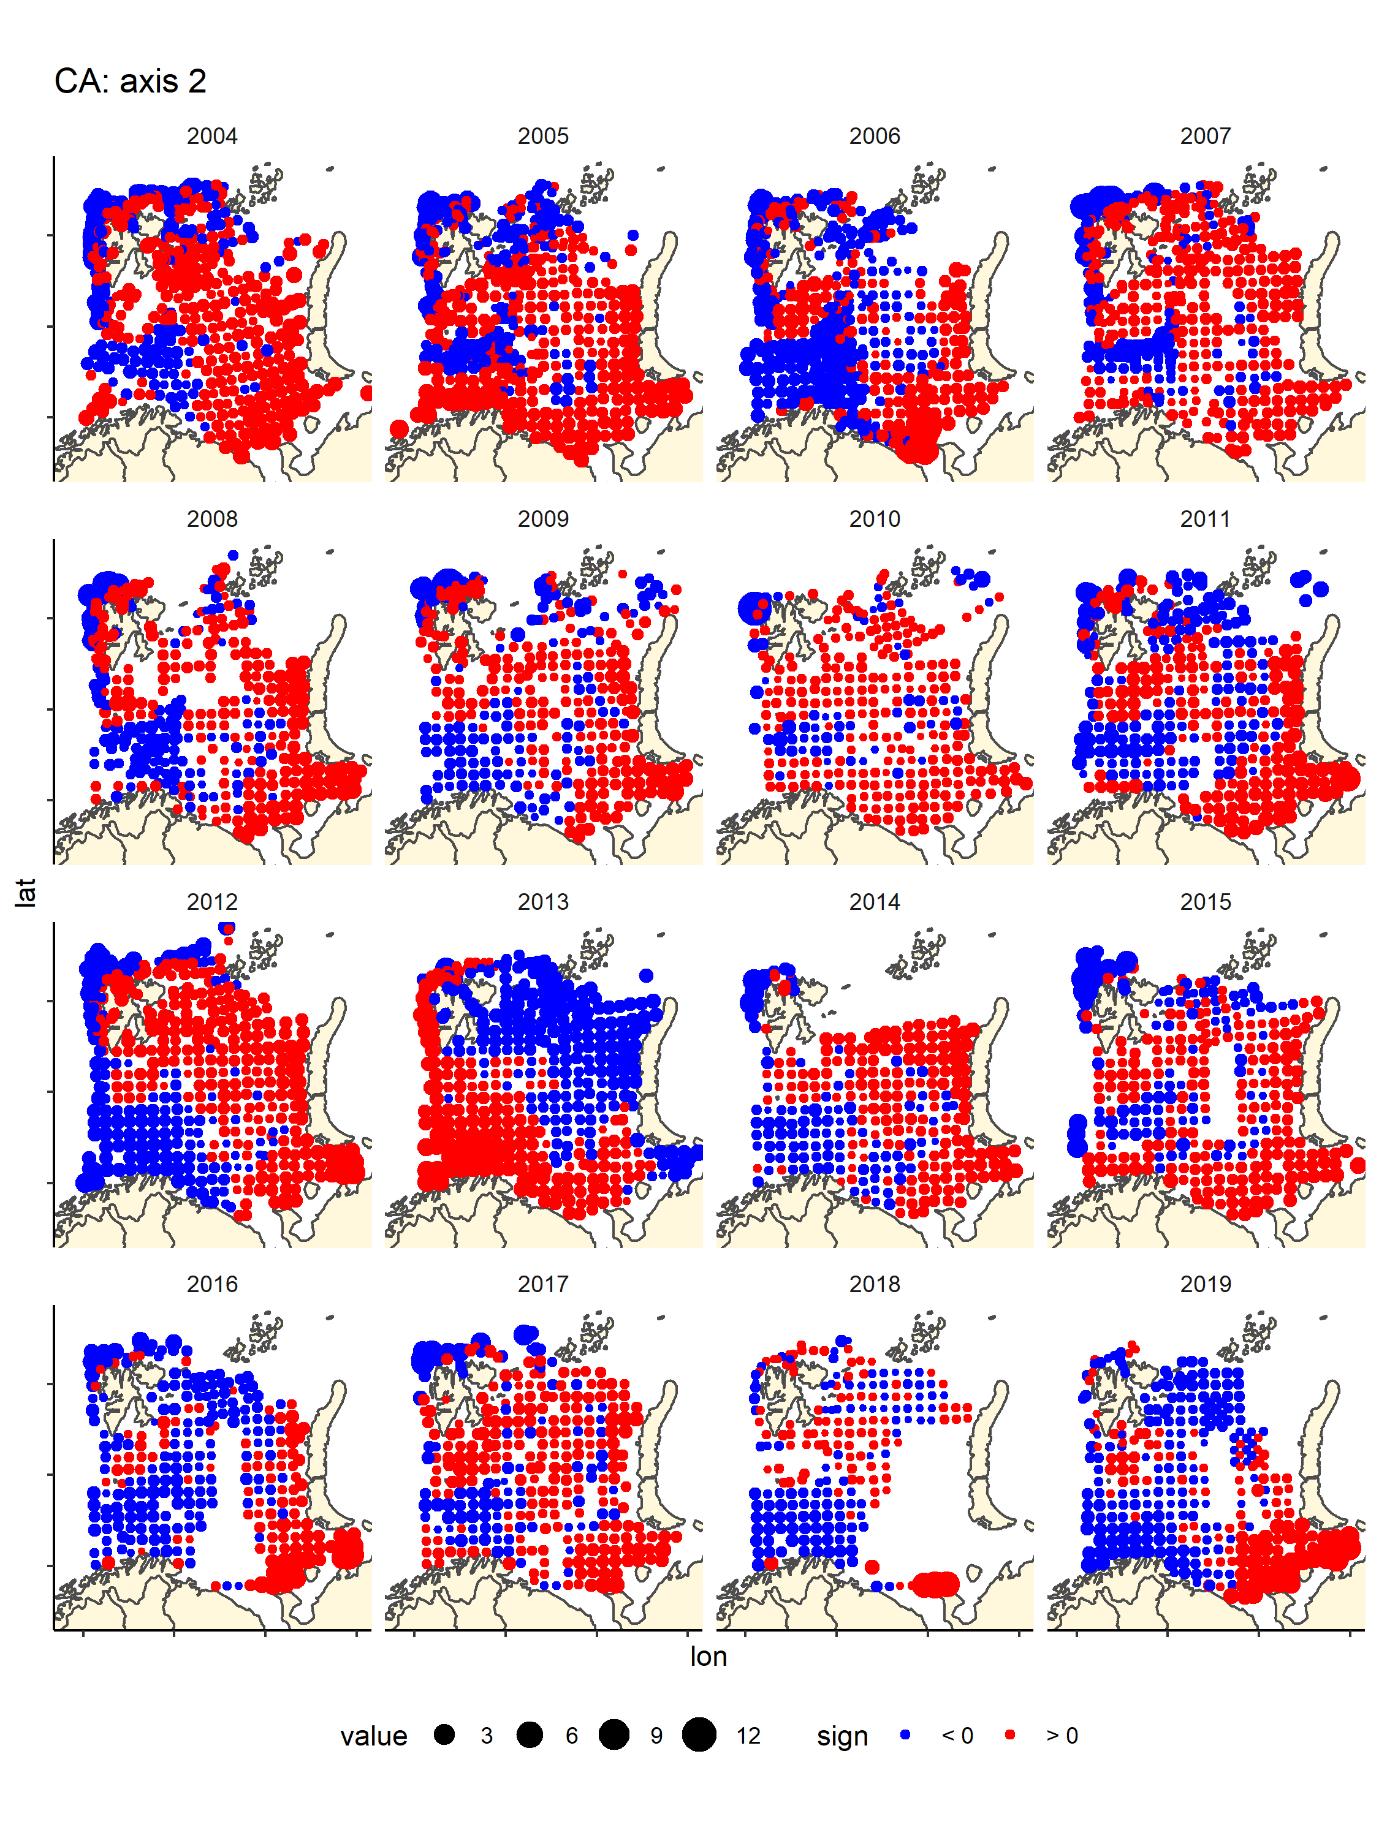
Figure 9. CA2 score by bottom trawl station, presence - absence fish data by year- generally blue are deeper water areas – Hopen trench – slope and central basin, and red are banks/shallow areas (south-east, Novaya Zemlya Bank and Svalbard bank), but the pattern is not as clear in all years, especially the most recent ones.
4 - Conclusions
The Barents Sea ecosystem survey is one of the most – if not the most comprehensive regular surveys in Arctic waters, covering a large area of approximately 1.6 mill km 2 in years with complete coverage. T his primary fishery-targeted survey provides also unique regular long-term data on fish biodiversity in the Barents Sea, which cannot be obtained in other single national research expeditions. Fish diversity data from this survey has already been used to study spatial variation in fish diversity and species composition in relation to environmental gradients (Johannesen et al 2012, Dolgov 2016, Bergstad et al 2018) and to map the distribution of the fish species (Wienerroither et al 2011, Dolgov 2016). Significant changes in the fish community structure including beta diversity, species composition, functional diversity and traits composition of the Barents Sea fishes between 2004-2012 have been documented (Wiedmann et al 2014, Fossheim et al 2015, Frainer et al 2018, Ellingsen et al 2020).
The fish data from the ecosystem survey reflects the general recent state of fish biodiversity in the Barents Sea. The number of species in the data set from the ecosystem survey is in accordance with the total fish species number in the Barents Sea: 207-222 species (Dolgov 2004, 2016), taking into account that several species from the families Myctophidae and Ammodytidae and genera Icelus , Careproctus , and Gymnelus were pooled in our data set, and that many occasional and old records (e.g. of Histrio histrio ) were included in Dolgov (2004,2016). Furthermore, some shallow-water species (e.g. Pholis gunnellus , Chirolophis ascanii ), which inhabit depths (< 50 m) not sampled during the ecosystem survey, were included in Dolgov (2004,2016). IMR and PINRO should continue these investigations to provide the fundament for further research including the impact of fisheries and climatic change on fish communities in the Barents Sea and in the Arctic.
Continuous effort is required to maintain the quality of the fish data (species identification etc). The best way to detect errors and improve methods and routines for sampling are through repeated use and analysis of the data ( Lindenmayer and Likens 2010 ). As of now, parts of the fish data are presented in the annual survey reports. Non-commercial fish species pooled by zoogeographical group are reported in the annual WGIBAR reports (e.g. ICES 2020), but there is scope for more detailed annual analyses and reporting. It is important that researchers at IMR and PINRO continue to analyse, report on and do research on the data and report back if errors and inconsistencies are detected. The data from samples taken at the survey by Norwegian boats are now made available for external users, which should open up for more research on the data, more insights and hopefully also improved data quality.
5 - References
Andriyashev AP and Chernova NV 1995. Annotated list of fish-like vertebrates and fishes of the Arctic Seas and adjacent waters. Journal of Icthyology 34:435-456
Bergstad OA, Johannesen E, Høines Å, Ellingsen KE, Lien VS, Byrkjedal I, Yoccoz NG, Tveraa T, Wienerroither R, Langhelle G, de Lange Wenneck T 2018. Demersal fish assemblages in the boreo-Arctic shelf waters around Svalbard during the warm period 2007–2014. Polar Biology 41: 125–142.
Dolgov AV 2004. Species composition of ichthyofauna and structure of Barents Sea ichthyocenosises. Izvestiya TINRO 137:177-195. ( in Russian)
Dolgov AV 2016. Composition, formation and trophic structure of the Barents Sea fish communities. K. M. Sokolov (Ed). PINRO Press, 2016. Murmansk. 336 pp. ( in Russian)
Ellingsen KE, Yoccoz NG, Tveraa T, Frank KT, Johannesen E, Anderson MJ, Dolgov AV, Shackell NL 2020. The rise of a marine generalist predator and the fall of beta diversity. Global Change Biology: 26: 2897– 2907. https://doi.org/10.1111/gcb.15027
Fossheim M, Primicerio R, Johannesen E, Ingvaldsen RB, Aschan M and Dolgov AV. 2015. Recent warming leads to a rapid borealization of fish communities in the Arctic. Nature Climate Change 5, 673–677
Frainer A, Primicerio R, Kortsch S, Aune M, Dolgov AV, Fossheim M et al. 2018. Climate-driven changes in functional biogeography of Arctic marine fish communities. Proceedings of the National Academy of Sciences of the United States of America, 114, 12202-12207.
Fricke R, Eschmeyer WN, & van der Laan R (eds) 2021. ESCHMEYER'S CATALOG OF FISHES: GENERA, SPECIES, REFERENCES. (http://researcharchive.calacademy.org/research/ichthyology/catalog/fishcatmain.asp). Electronic version accessed 09 march 2021.
ICES. 2020. Working Group on the Integrated Assessments of the Barents Sea (WGIBAR). ICES Scientific Reports. 2:30. 206 pp. http://doi.org/10.17895/ices.pub.5998
Johannesen E, Wenneck T, Høines Å, Aglen A, Mehl S, Mjanger H, Fotland Å, Halland TI, Jakobsen T. 2009. Egner vintertoktet seg til overvåking av endringer i fiskesamfunnet i Barentshavet? : en gjennomgang av metodikk og data fra 1981-2007. Fisken og havet Nr. 7 – 2009. 29 pp. (In Norwegian).
Johannesen E, Høines Å, Dolgov AV, Fossheim M 2012. Demersal Fish Assemblages and Spatial Diversity Patterns in the Arctic-Atlantic Transition Zone in the Barents Sea. PLoS ONE 7(4): e34924. doi:10.1371/journal.pone.0034924.
Johannesen E, Mørk HL, Korsbrekke K, Wienerroither R, Eriksen E, Fossheim M, Wenneck T, Dolgov AV, Prokhorova T, and Prozorkevich D 2017a. Arctic fishes in the Barents Sea 2004-2015: Changes in abundance and distribution. IMR PINRO Joint Report Series 1-2017.
Johannesen E, Jørgensen LL, Fossheim M, Primicerio R, Greenacre M, Lubin P, Dolgov AD, Ingvaldsen RB, Anisimova N and Manushyn I 2017b. Joint response to environmental gradients by Barents Sea mega-benthos and demersal fish communities. Polar Biology 40: 237–246
Johannesen E, Johansen GO, Korsbrekke K, Johnsen E 2019. Estimation of swept area indices with CVs for haddock and cod in the Barents Sea winter survey 12004 – 2018 applying the Sea2Data StoX software. Fisken og havet 2019-6 ISSN:1894-5031
Johnsen E, Totland A , Skålevik Å , et al. 2019. StoX: An open source software for marine survey analyses. Methods in Ecology and Evolution 2019; 10: 1523 – 1528.https://doi.org/10.1111/2041-210X.13250
Lindenmayer DB, Likens GE 2010. Effective ecological monitoring. CSIRO Publishing, London, 170 pp.
Magurran AE 2004. Measuring Biological Diversity. Blackwell Publishing Company.
Mecklenburg CW, Lynghammar A, Johannesen E, Byrkjedal I, Christiansen JS, Dolgov AV, Karamushko OV, Mecklenburg TA, Møller PR, Steinke D, Wienerroither RM 2018. Marine fishes of the arctic region. Volume I and II. Conservation of Arctic Flora and Fauna Monitoring Series Report 28. Akureyri, Iceland.
Stiansen JE and Filin AA (Eds) 2008. Joint PINRO/IMR report on the state of the Barents Sea ecosystem 2007, with expected situation and consideration for management. IMR/PINRO Joint Report Series No. 1/2008.
Wiedmann MA, Aschan M, Certain G, Dolgov AV, Greenacre M, Johannesen E., Planque B and Primicerio R. 2014. Functional diversity of the Barents Sea fish community. Marine Ecology progress series 495: 205–218.
Wienerroither R, Johannesen E, Dolgov AV, Byrkjedal I, Bjelland O, Drevetnyak K, Eriksen KB, Høines Å, Langhelle G, Langøy H, Prokhorova T, Prozorkevich D and Wenneck T. 2011. Atlas of the Barents Sea Fishes. IMR/PINRO Joint Report Series 1-2011. 272 pp.
Yoccoz, N.G., Ellingsen, K.E. & Tveraa, T. (2018) Biodiversity may wax or wane depending on metrics or taxa. Proceedings of the National Academy of Sciences of the United States of America, 115, 1681-1683.
6 - Appendix 1 Survey reports Ecosystem survey 2004-2019
Anon. 2004. Survey report from the Joint Norwegian/Russian Ecosystem Survey in the Barents Aea August-October 2004 (vol. 1). IMR/PINRO Joint reports Series No 3/2004. ISSN 1502-8828 68 pp.
Anon. 2005. Survey report from the Joint Norwegian/Russian ecosystem survey in the Barents Sea August-October 2005, Volume 1, IMR/PINRO Joint Report Series, No. 3/2005. ISSN 1502-8828. 99 pp.
Anon.2006. Survey from the joint Norwegian/Russian ecosystem survey in the Barents Sea in August-October 2006 (vol.1). IMR/PINRO Joint Report Series, No.2/2006.ISSN 1502-8828.90 pp.
Anon. 2007. Survey report from the joint Norwegian/Russian ecosystem Survey in the Barents Sea August-October 2007 (vol.1). IMR/PINRO Joint Report Series, No. 4/2007. ISSN 1502-8828. 97 pp.
Anon. 2009. Survey report from the joint Norwegian/Russian ecosystem survey in the Barents Sea August-October 2008 volume 1. IMR/PINRO Joint Report Series, No. 1/2009. ISSN 1502-8828. 103 pp.
Anon. 2010. Survey report from the joint Norwegian/Russian ecosystem survey in the Barents Sea August-October 2009. IMR/PINRO Joint Report Series, No. 2/2010. ISSN 1502-8828. 118 pp.
Anon. 2010. Survey report from the joint Norwegian/Russian ecosystem survey in the Barents Sea August-September 2010. IMR/PINRO Joint Report Series, No. 4/2010. ISSN 1502-8828. 108 pp.
Anon. 2011. Survey report from the joint Norwegian/Russian ecosystem survey in the Barents Sea August-October 2011. IMR/PINRO Joint Report Series, No. 3/2011. ISSN 1502-8828. 118 pp.
Eriksen, E. (Ed.). 2012. Survey report from the joint Norwegian/Russian ecosystem survey in the Barents Sea August-October 2012. IMR/PINRO Joint Report Series, No. 2/2012. ISSN 1502-8828, 139 pp.
Prokhorova, T. (Ed.). 2013. Survey report from the joint Norwegian/Russian ecosystem survey in the Barents Sea and adjacent waters, August-October 2013. IMR/PINRO Joint Report Series, No. 4/2013. ISSN 1502-8828, 131 pp.
Eriksen, E. 2015. (Ed.) Survey report from the joint Norwegian/Russian ecosystem survey in the Barents Sea and adjacent waters, August-October 2014. IMR/PINRO Joint Report Series, No. 1/2015, 153 pp. ISSN 1502-8828
Prozorkevich, D. Sunnanå K. 2016 (Eds.) Survey report from the joint Norwegian/Russian ecosystem survey in the Barents Sea and adjacent waters, August- October 2015. IMR/PINRO Joint Report Series, No. 1/2016, 77 pp. ISSN 1502-8828
Prozorkevich, D. and Sunnanå K. 2017 (Eds.) Survey report from the joint Norwegian/Russian ecosystem survey in the Barents Sea and adjacent waters, August-October 2016. IMR/PINRO Joint Report Series, No. 2/2017, 101 pp. ISSN 1502-8828
Prozorkevich, D., Johansen G.O., and van der Meeren, G.I. 2018 (Eds.) Survey report from the joint Norwegian/Russian ecosystem survey in the Barents Sea and adjacent waters, August-October 2017. IMR/PINRO Joint Report Series, No. 2/2018, 97 pp.
Prozorkevich, D., van der Meeren G.I. (Eds) 2019. Survey report from the joint Norwegian/ Russian ecosystem survey in the Barents Sea and adjacent waters August- October 2018. IMR/PINRO Joint Report Series, 2-2019, 93pp.
Prozorkevich, D., van der Meeren G.I. (Eds) 2020.Survey report from the joint Norwegian/ Russian ecosystem survey in the Barents Sea and adjacent waters August-October 2019. IMR/PINRO Joint Report Series, 1-2020, 93pp
7 - Appendix 2 Questionable records
Records outside the known distribution area or depth range that were coded as questionable in the data base. Norwegian records only. These should be removed from the data prior to the analysis. Please note that the list is incomplete, due to various changes in the IMR data bases over the years. Also note that prior to 2006/2007 many of the eelpouts (see appendix 3) and liparids were wrongly identified, we therefore recommend pooling eelpouts and liparids to the family level these years.
| Year | Cruise | Serialnumber | Species | Justification |
|---|---|---|---|---|
| 2004 | 2004703 | 2121 | Sebastes viviparus | position |
| 2004 | 2004703 | 2132 | Sebastes viviparus | position |
| 2004 | 2004703 | 2133 | Sebastes viviparus | position |
| 2004 | 2004210 | 2308 | Triglops pingelii | position |
| 2004 | 2004210 | 2505 | Triglops pingelii | position |
| 2004 | 2004210 | 2394 | Triglops pingelii | position |
| 2004 | 2004210 | 2386 | Triglops pingelii | position |
| 2004 | 2004210 | 2405 | Triglops pingelii | position |
| 2005 | 2005111 | 2901 | Bathyraja spinicauda | Position |
| 2005 | 2005209 | 2481 | Phycis blennoides | position |
| 2005 | 2005209 | 2484 | Phycis blennoides | position |
| 2005 | 2005111 | 2769 | Sebastes viviparus | position |
| 2005 | 2005111 | 2831 | Sebastes viviparus | position |
| 2005 | 2005111 | 2832 | Sebastes viviparus | position |
| 2005 | 2005111 | 2821 | Sebastes viviparus | position |
| 2005 | 2005111 | 2839 | Sebastes viviparus | position |
| 2005 | 2005702 | 2098 | Sebastes viviparus | position |
| 2005 | 2005702 | 2034 | Sebastes viviparus | position |
| 2005 | 2005702 | 2058 | Sebastes viviparus | position |
| 2005 | 2005702 | 2060 | Sebastes viviparus | position |
| 2005 | 2005702 | 2059 | Sebastes viviparus | position |
| 2005 | 2005702 | 2065 | Sebastes viviparus | position |
| 2005 | 2005702 | 2066 | Sebastes viviparus | position |
| 2005 | 2005209 | 2369 | Sebastes viviparus | position |
| 2005 | 2005209 | 2371 | Sebastes viviparus | position |
| 2005 | 2005111 | 2710 | Triglops nybelini | position |
| 2006 | 2006211 | 2376 | Amblyraja hyperborea | Position |
| 2006 | 2006704 | 2195 | Liparis liparis | un-reliable when not verified |
| 2006 | 2006211 | 2484 | Liparis liparis | un-reliable when not verified |
| 2006 | 2006113 | 2674 | Sebastes viviparus | position |
| 2006 | 2006113 | 2712 | Sebastes viviparus | position |
| 2006 | 2006113 | 2741 | Sebastes viviparus | position |
| 2006 | 2006704 | 2187 | Sebastes viviparus | position |
| 2006 | 2006704 | 2095 | Sebastes viviparus | position |
| 2006 | 2006704 | 2114 | Sebastes viviparus | position |
| 2006 | 2006704 | 2115 | Sebastes viviparus | position |
| 2007 | 2007702 | 2107 | Cyclopteropsis macalpini | un-reliable when not verified |
| 2007 | 2007210 | 2434 | Cyclopteropsis macalpini | un-reliable when not verified |
| 2007 | 2007110 | 2736 | Sebastes viviparus | position |
| 2007 | 2007110 | 2692 | Sebastes viviparus | position |
| 2007 | 2007110 | 2691 | Sebastes viviparus | position |
| 2007 | 2007110 | 2719 | Sebastes viviparus | position |
| 2007 | 2007702 | 2104 | Sebastes viviparus | position |
| 2007 | 2007210 | 2380 | Sebastes viviparus | position |
| 2007 | 2007210 | 2357 | Sebastes viviparus | position |
| 2008 | 2008703 | 2028 | Merlangius merlangus | position |
| 2008 | 2008703 | 2106 | Sebastes viviparus | position |
| 2009 | 2009208 | 2510 | Lycodes reticulatus | position and size |
| 2009 | 2009208 | 2494 | Myoxocephalus quadricornis | position and depth |
| 2009 | 2009208 | 2329 | Rhodichthys regina | position and depth |
| 2009 | 2009208 | 2444 | Sebastes viviparus | position |
| 2009 | 2009109 | 2703 | Triglops pingelii | position |
| 2009 | 2009109 | 2704 | Triglops pingelii | position |
| 2010 | 2010111 | 2668 | Enchelyopus cimbrius | position |
| 2010 | 2010703 | 2013 | Enchelyopus cimbrius | position |
| 2010 | 2010111 | 2663 | Limanda limanda | position |
| 2010 | 2010703 | 2092 | Liparis liparis | un-reliable when not verified |
| 2010 | 2010703 | 2037 | Liparis liparis | un-reliable when not verified |
| 2010 | 2010111 | 2618 | Lycodes reticulatus | position and size |
| 2010 | 2010703 | 2033 | Pholis gunnellus | position |
| 2011 | 2011717 | 2039 | Enchelyopus cimbrius | position |
| 2011 | 2011717 | 2040 | Enchelyopus cimbrius | position |
| 2012 | 2012111 | 2691 | Lycenchelys kolthoffi | position |
| 2012 | 2012111 | 2618 | Lycodes reticulatus | position |
| 2012 | 2012845 | 2010 | Pollachius pollachius | position and size |
| 2013 | 2013111 | 2716 | Sebastes viviparus | position |
| 2013 | 2013208 | 2343 | Sebastes viviparus | position |
| 2013 | 2013208 | 2314 | Sebastes viviparus | position |
| 2014 | 2014212 | 2412 | Macrourus berglax | Position |
| 2014 | 2014212 | 2418 | Sebastes viviparus | position |
| 2014 | 2014212 | 2420 | Sebastes viviparus | position |
| 2015 | 2015210 | 2330 | Sebastes viviparus | position |
| 2016 | 2016209 | 2213 | Rajella fyllae | position |
| 2016 | 2016209 | 2314 | Sebastes viviparus | position |
| 2016 | 2016209 | 2237 | Sebastes viviparus | position |
| 2016 | 2016209 | 2230 | Sebastes viviparus | position |
| 2017 | 2017209 | 2215 | Anisarchus medius | Position |
| 2017 | 2017113 | 2611 | Eutrigla gurnardus | position and size |
| 2017 | 2017113 | 2558 | Eutrigla gurnardus | position and size |
| 2017 | 2017113 | 2562 | Eutrigla gurnardus | position and size |
| 2017 | 2017113 | 2518 | Sebastes viviparus | position |
| 2019 | 2019113 | 2581 | Anarhichas denticulatus | Size |
| 2019 | 2019113 | 2583 | Anarhichas denticulatus | Size |
| 2019 | 2019113 | 2600 | Anarhichas denticulatus | Size |
| 2019 | 2019113 | 2626 | Anarhichas denticulatus | Size |
| 2019 | 2019113 | 2635 | Arctogadus glacialis | Position |
| 2019 | 2019209 | 2360 | Argentina silus | Position |
| 2019 | 2019813 | 2005 | Trisopterus minutus | Position |
8 - Appendix 3 Zoarcidae maps
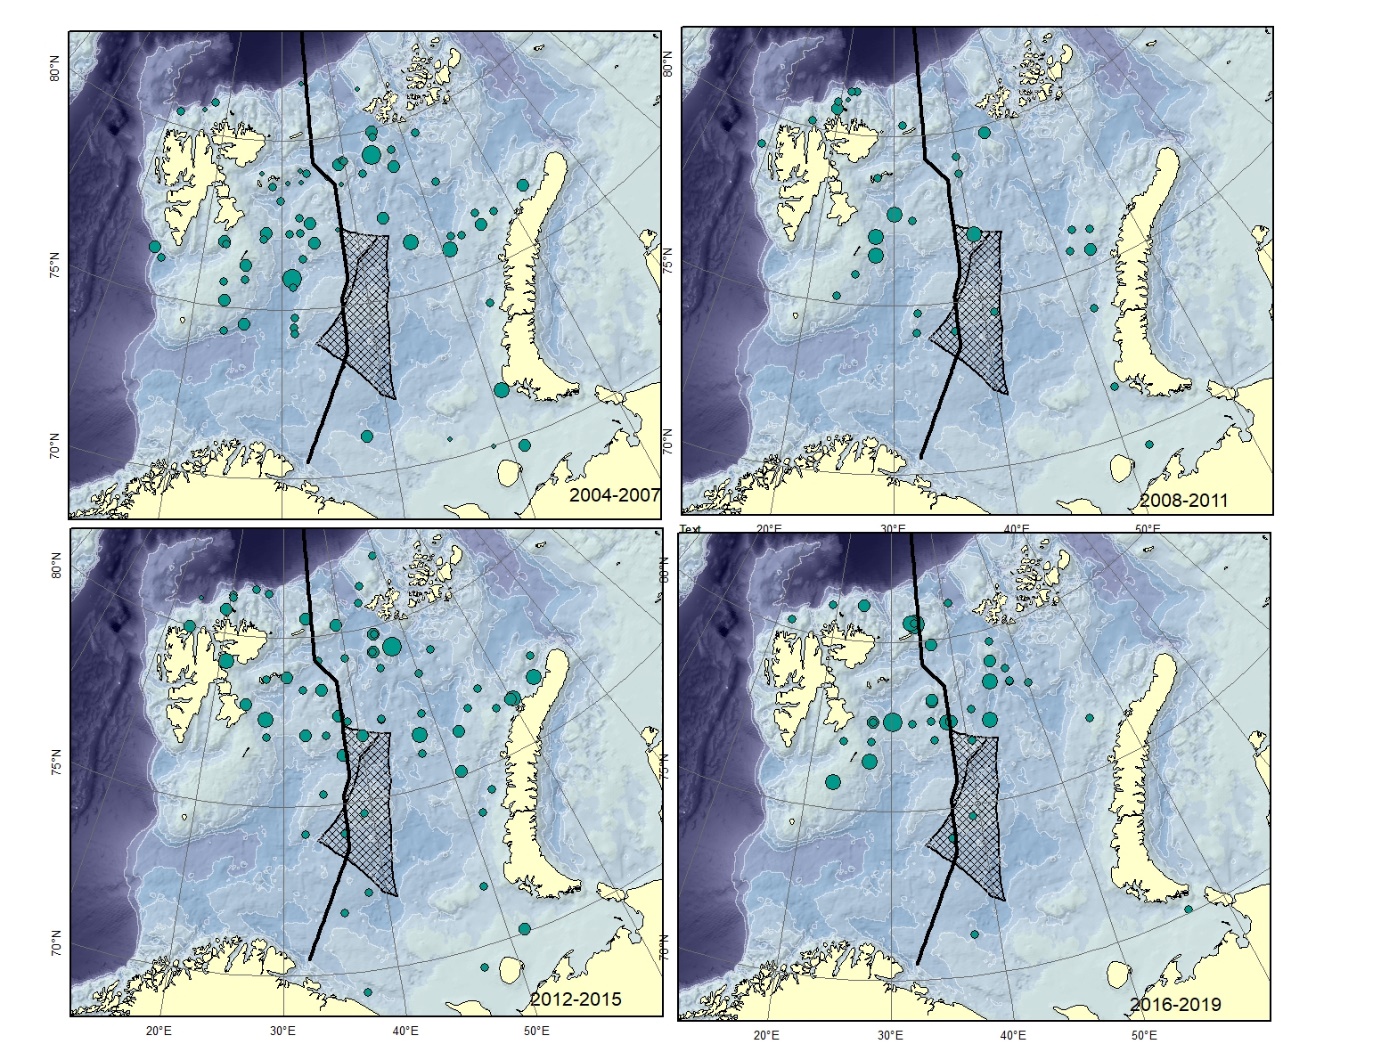
Figure A1. Gymnelus spp. Size of circle proportional to the number of specimens caught in the station. There are several species of this genus described from the area. These differ only in minor details, might represent ecophenotypes and therefore all be junior synonyms of Gymnelus retrodorsalis (Mecklenburg et al. 2018).
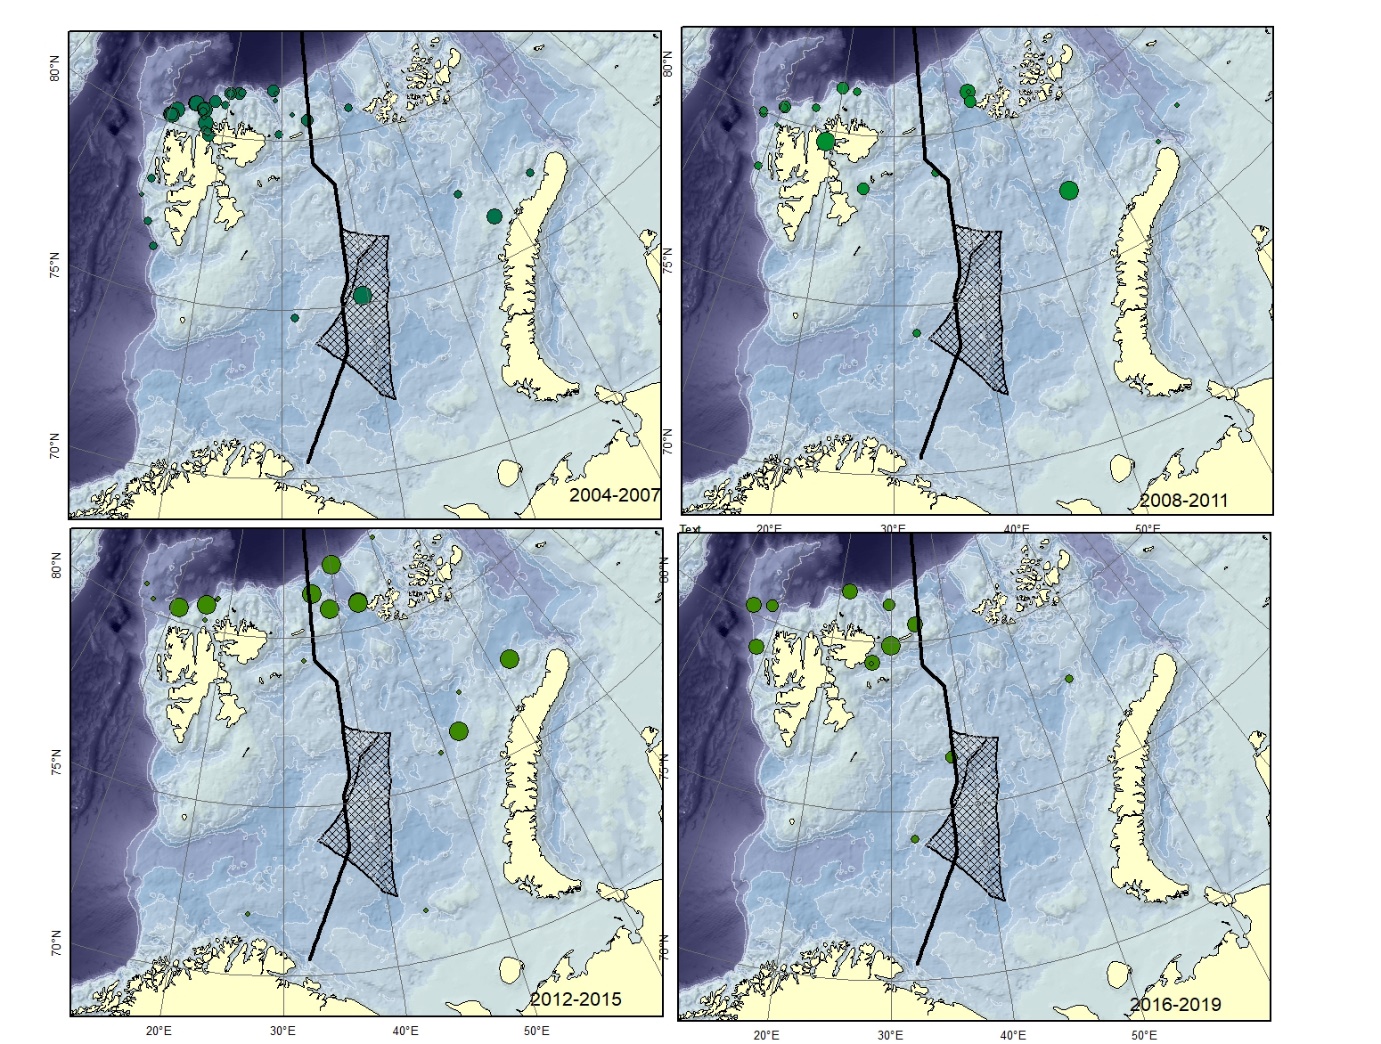
Figure A2. Lycenchelys kolthoffi. Size of circle proportional to the number of specimens caught in the station.
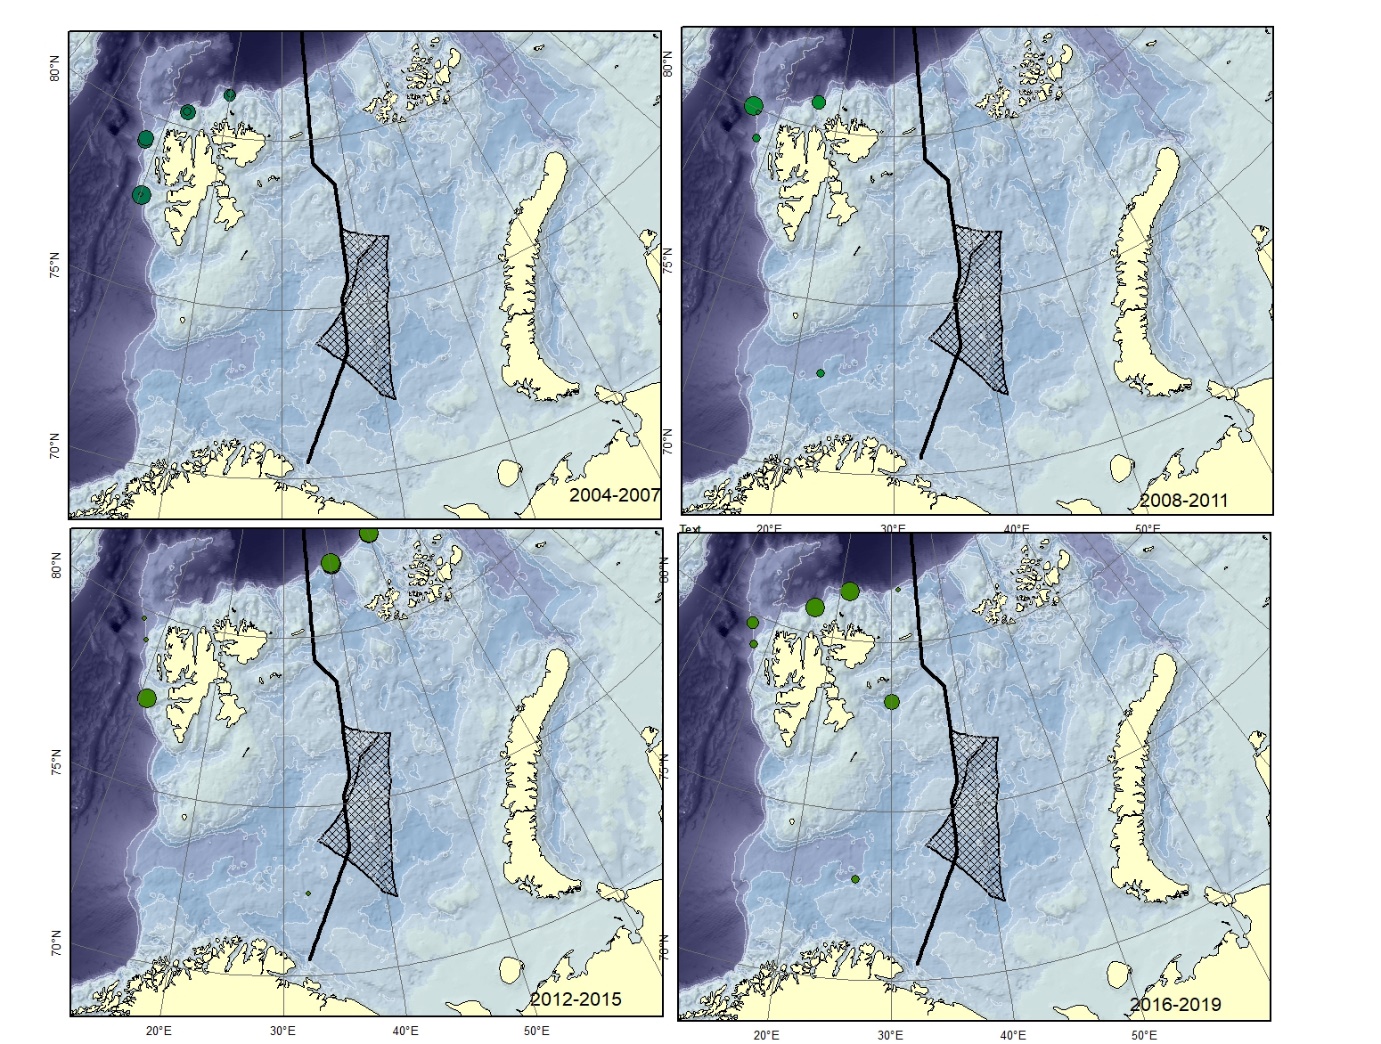
Figure A3. Lycenchelys muraena Size of circle proportional to the number of specimens caught in the station. Could be confused with L. sarsii .
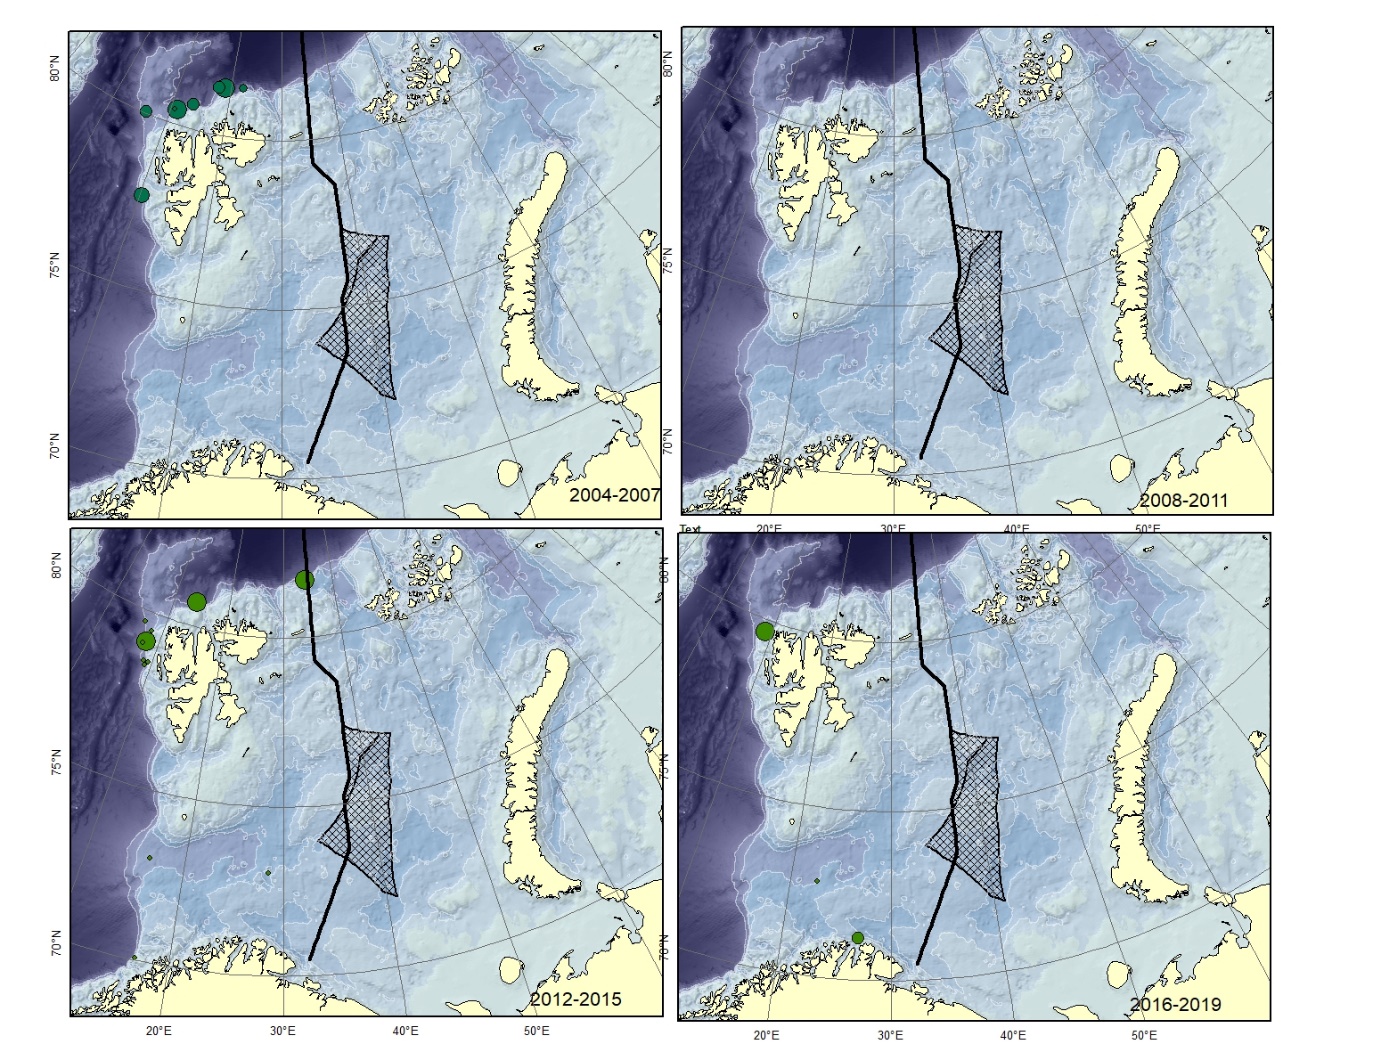
Figure A4. Lycenchelys sarsii Size of circle proportional to the number of specimens caught in the station. This species is not verified from Svalbard and can be confused with L. muraena .
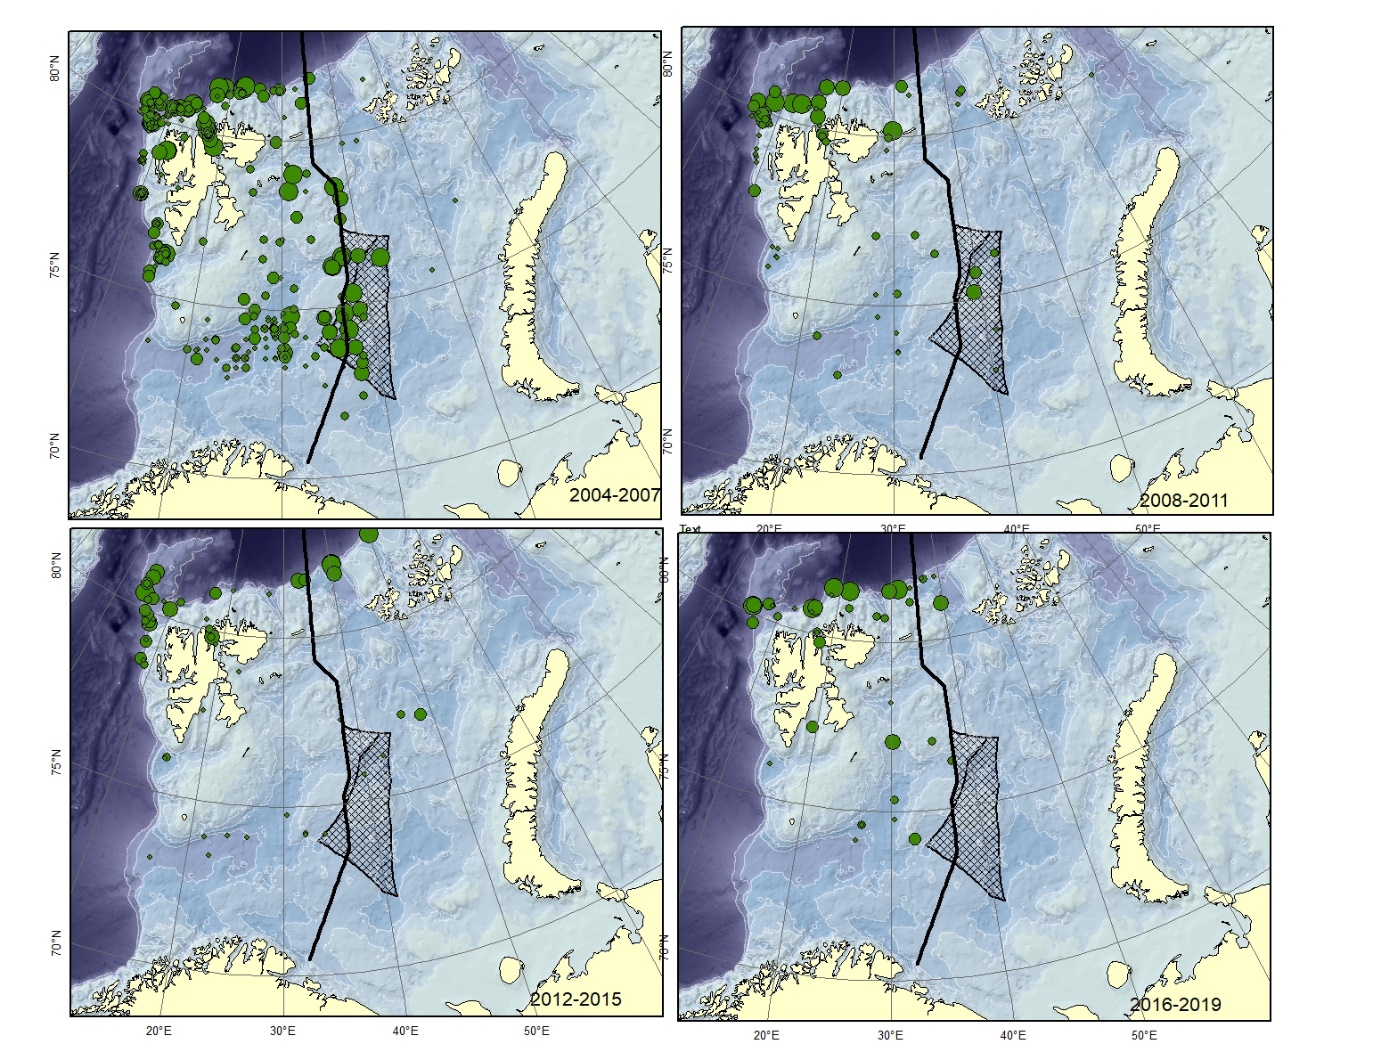
Figure A5. Lycodes eudipleurostictus Size of circle proportional to the number of specimens caught in the station. This species could be confused with other striped eelpouts, e.g. L. esmarkii , L. pallidus , L. rossi , or L. seminudus .
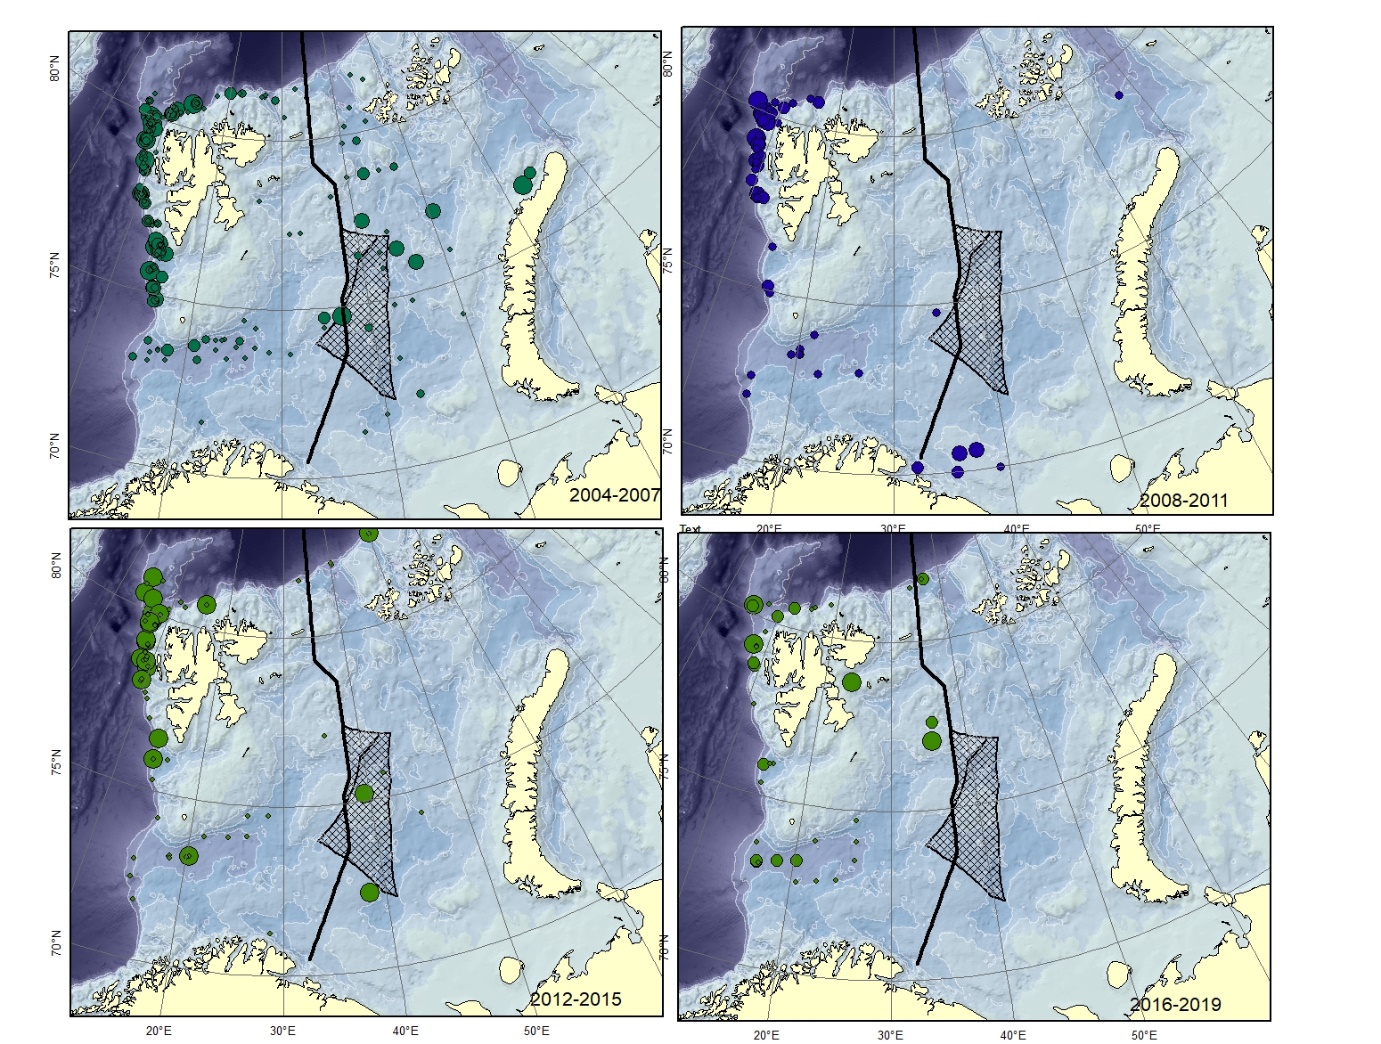
Figure A6. Lycodes esmarkii Size of circle proportional to the number of specimens caught in the station.
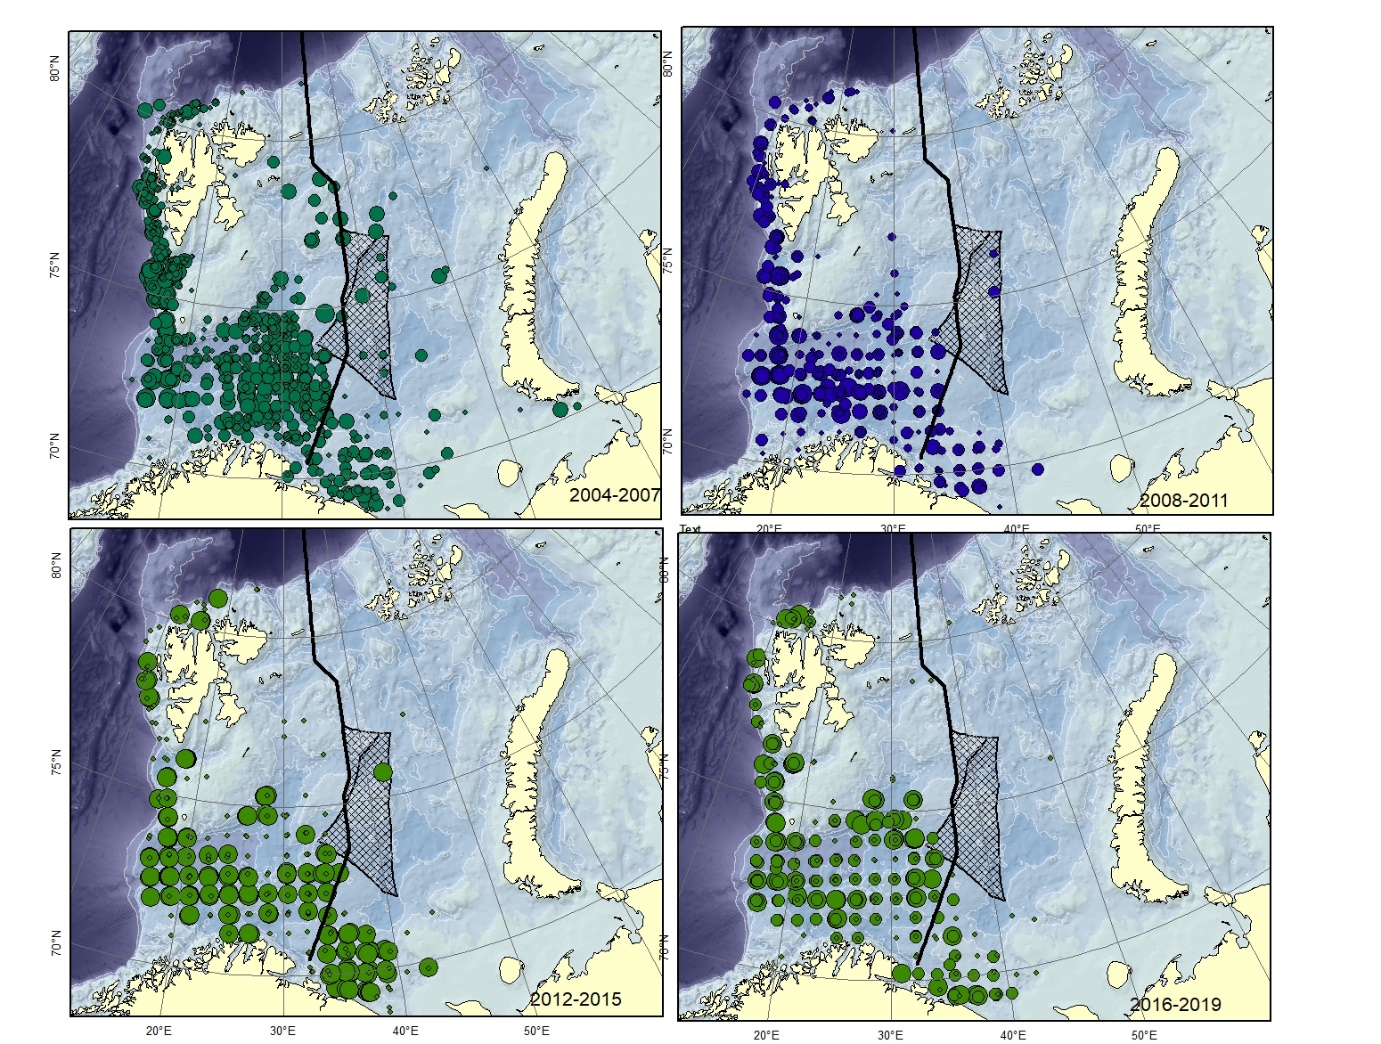
Figure A7. Lycodes gracilis Size of circle proportional to the number of specimens caught in the station.
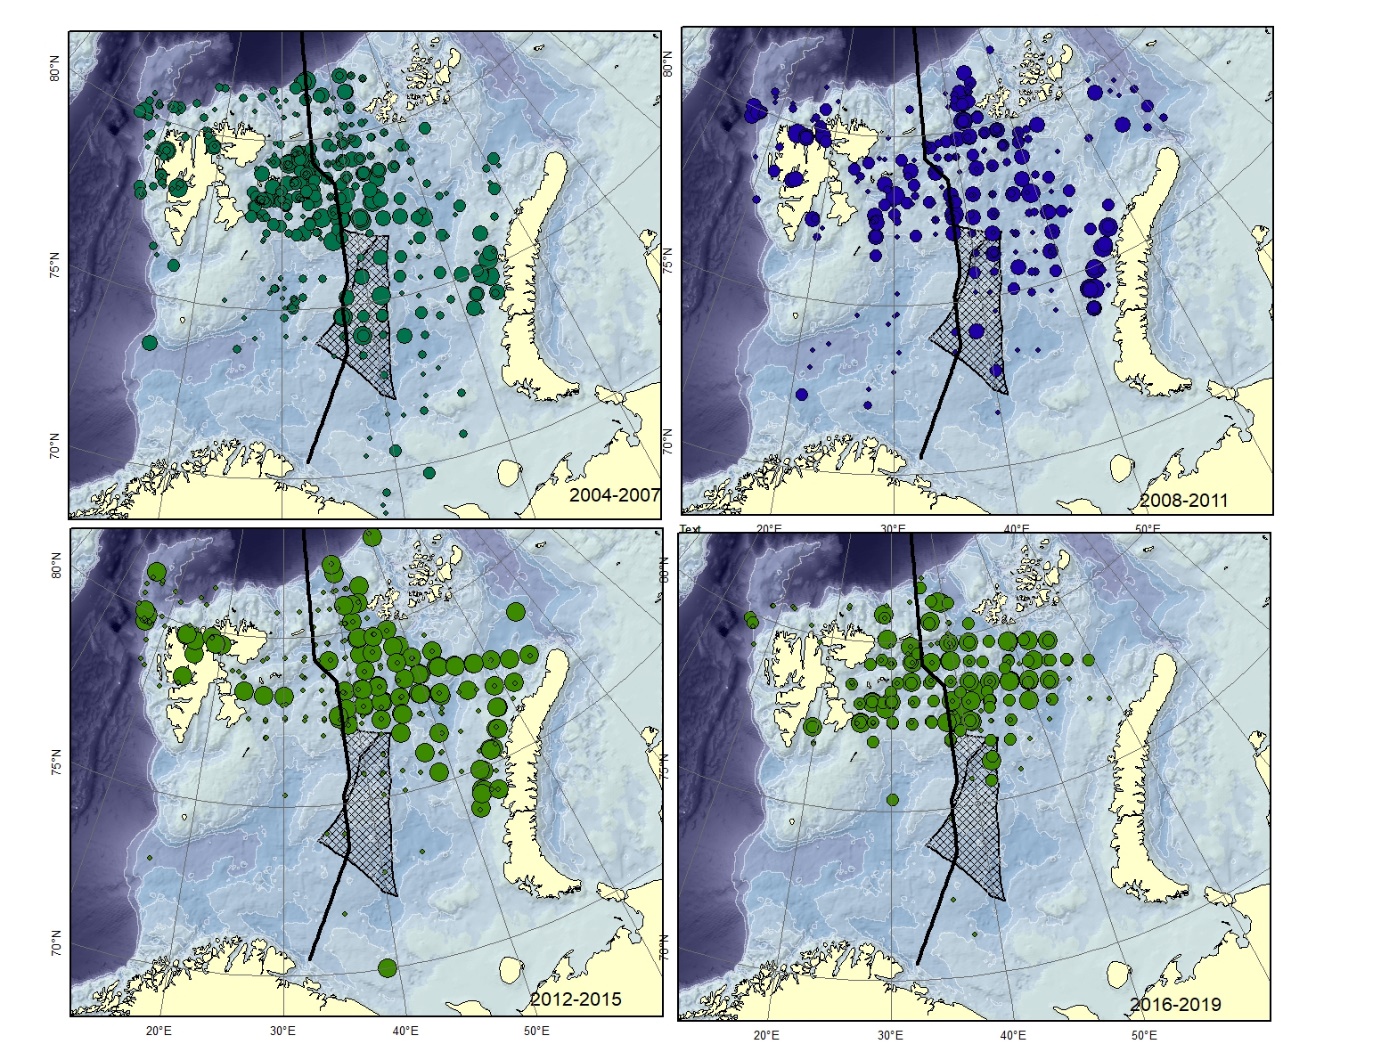
Figure A8. Lycodes pallidus Size of circle proportional to the number of specimens caught in the station. (could can be confused with L. paamiuti)
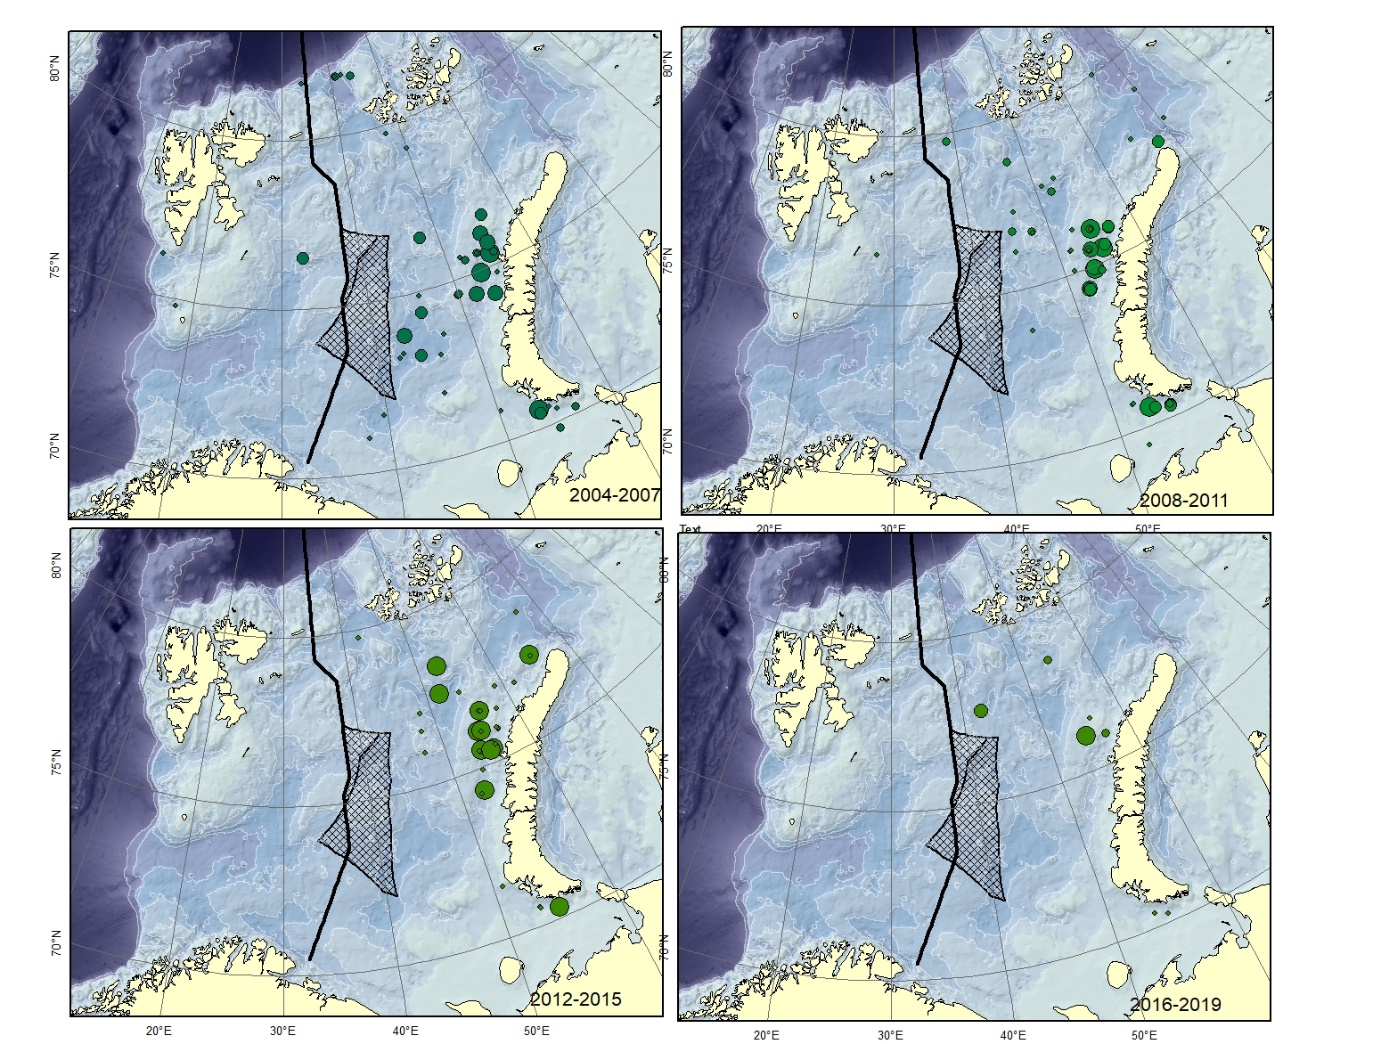
Figure A9. Lycodes polaris Size of circle proportional to the number of specimens caught in the station.
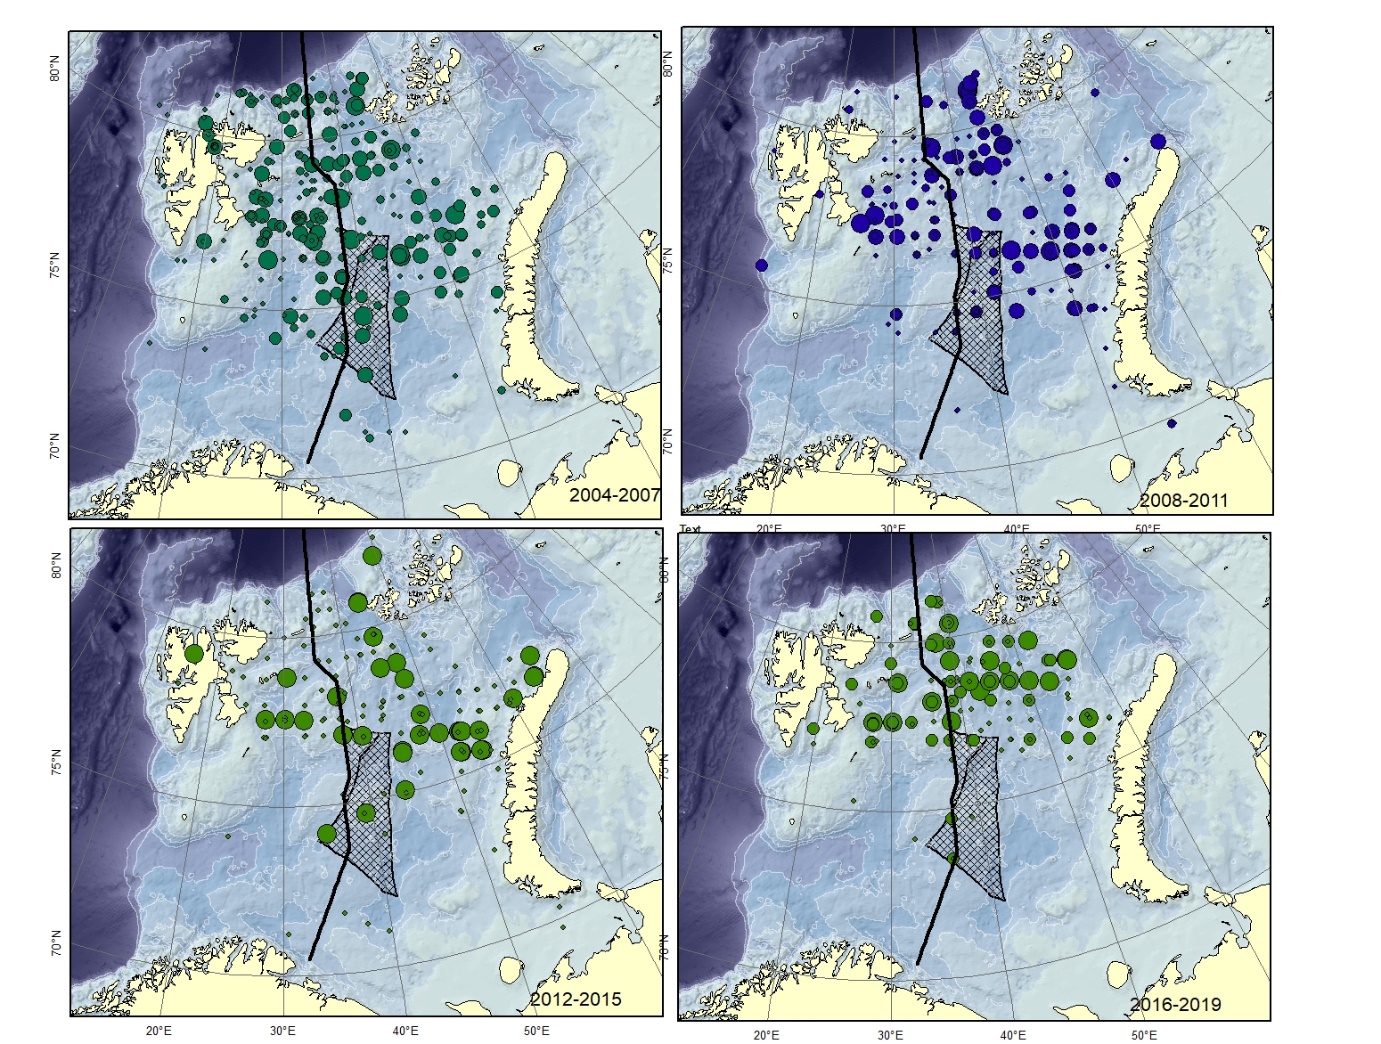
Figure A10. Lycodes reticulatus Size of circle proportional to the number of specimens caught in the station. Specimens smaller than 12-15 cm are very similar to L. rossi .
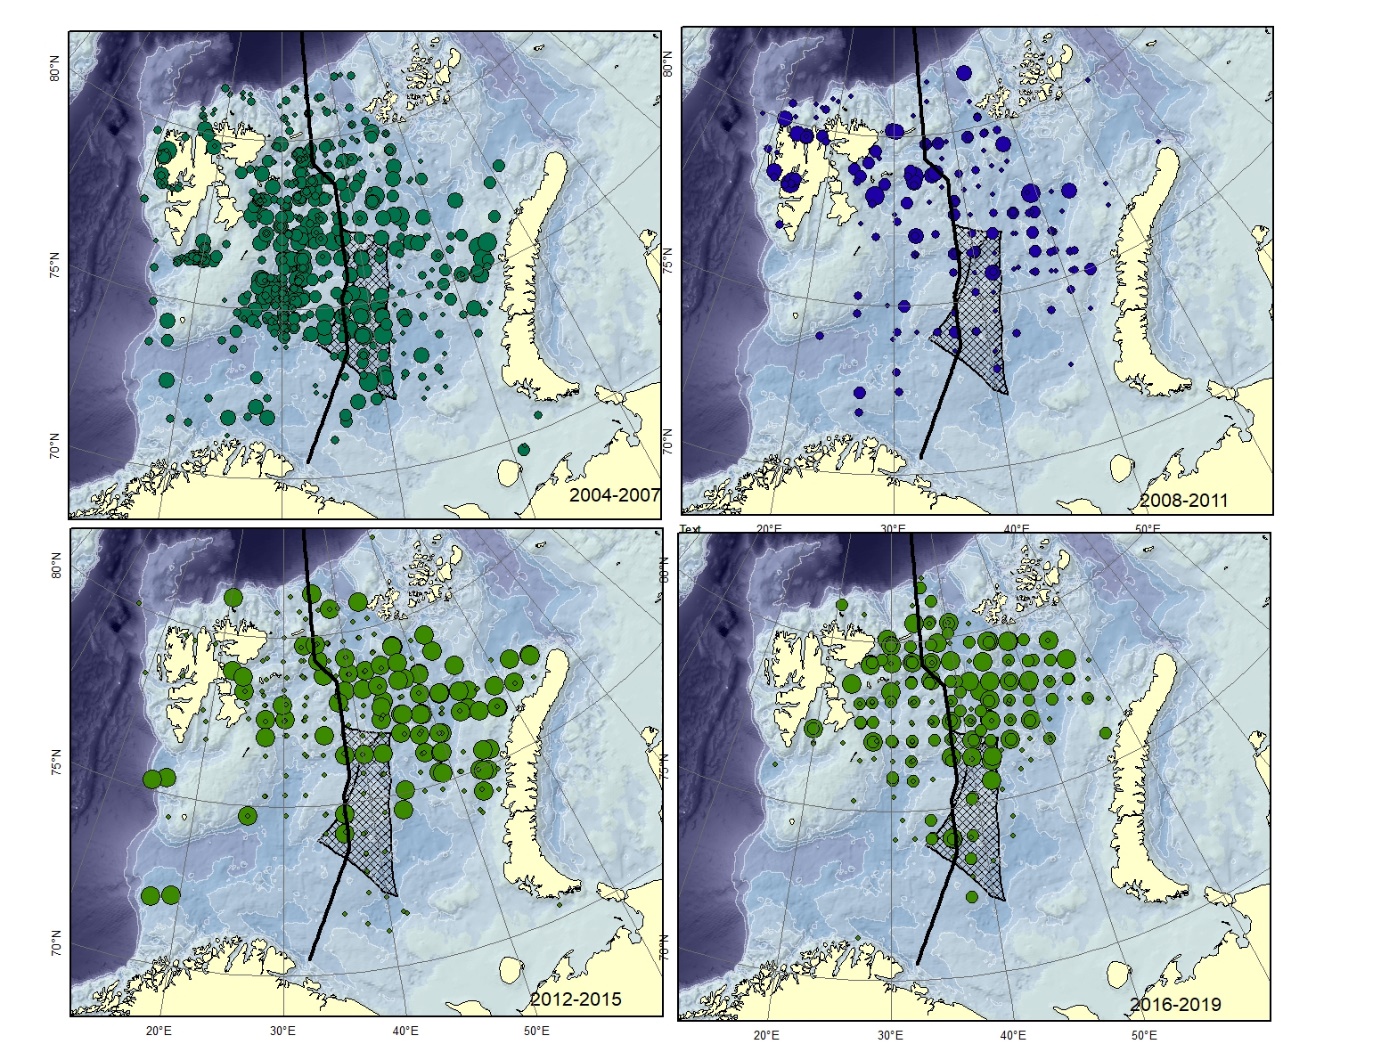
Figure A11. Lycodes rossi. Size of circle proportional to the number of specimens caught in the station.
Specimens smaller than 12-15 cm are very similar to L. reticulatus
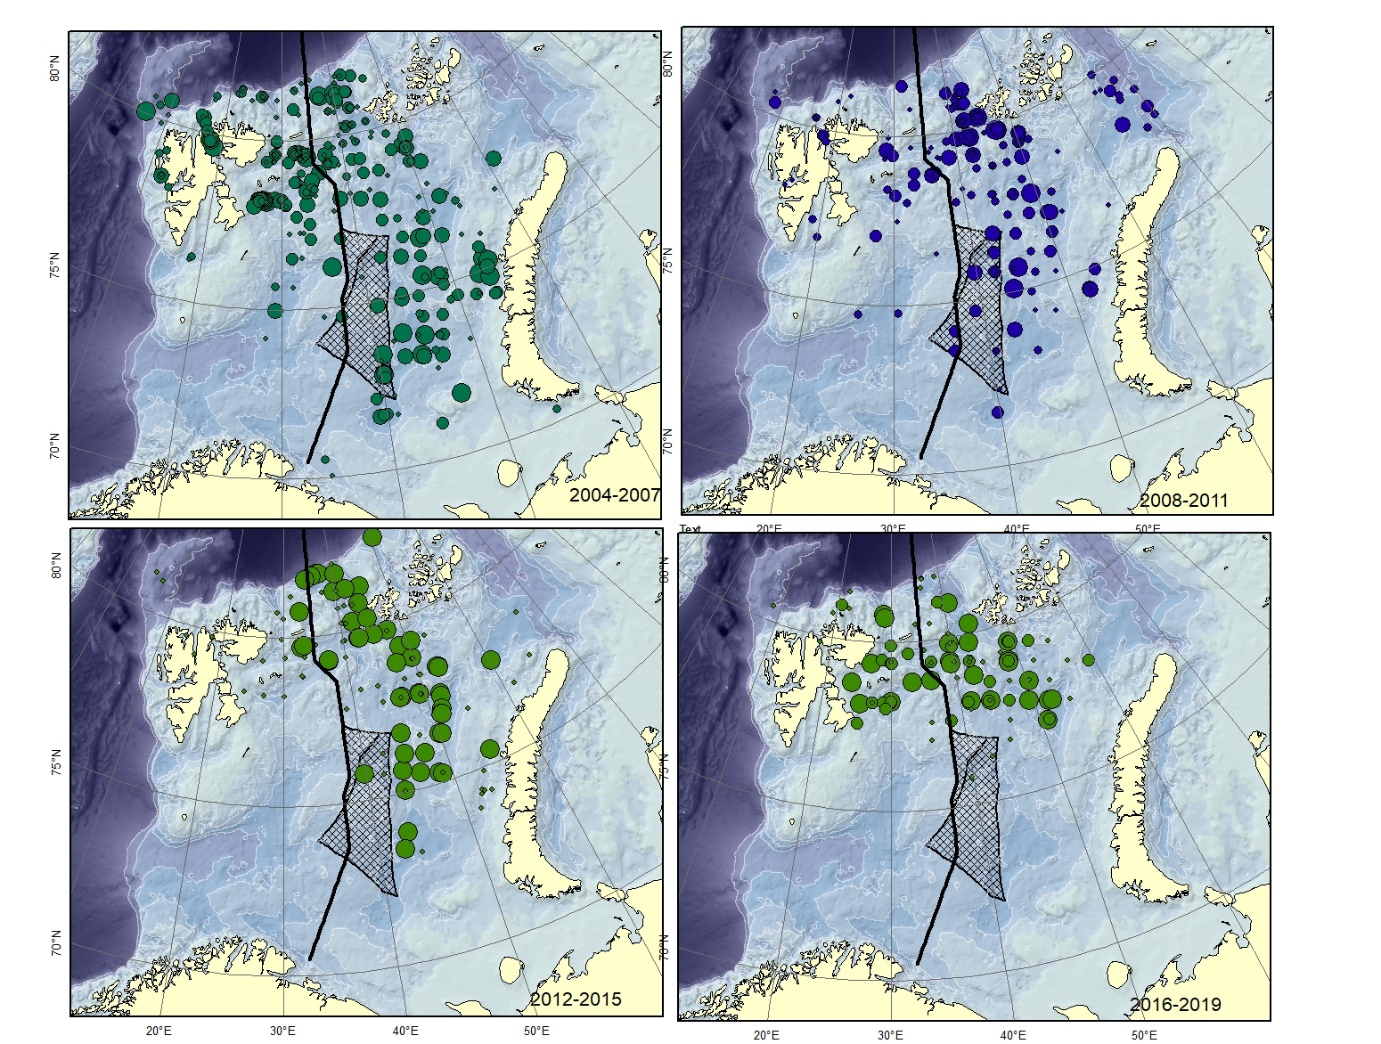
Figure A12. Lycodes seminudus Size of circle proportional to the number of specimens caught in the station.
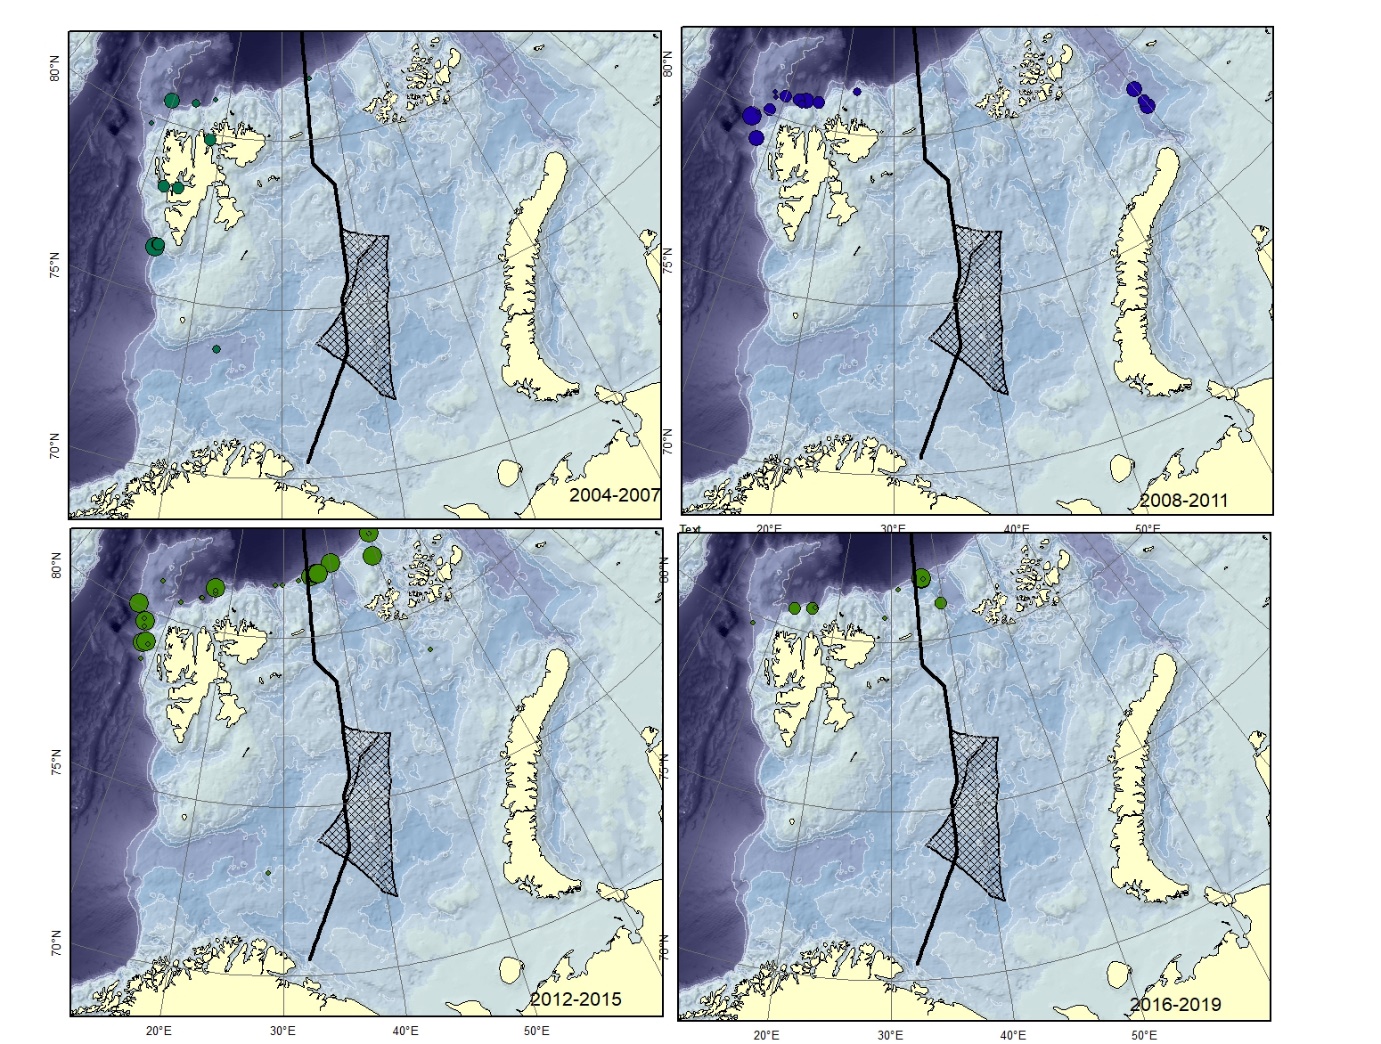
Figure A13. Lycodes squamiventer (could be mistaken for L. sagittarius ). Size of circle proportional to the number of specimens caught in the station.
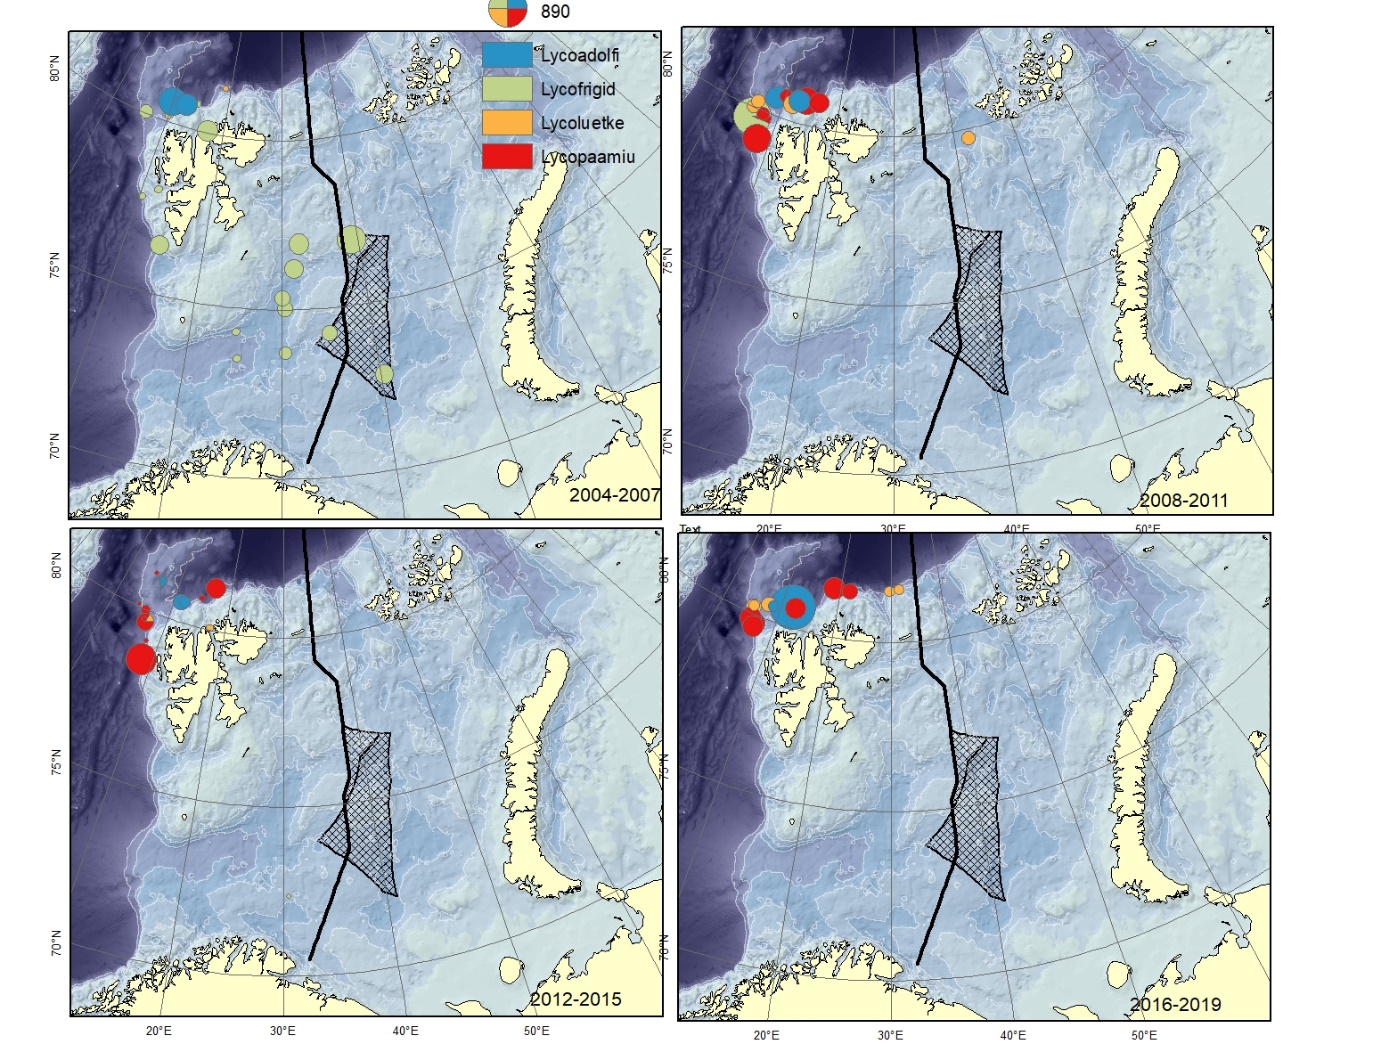
Figure A14. Lycodes adolfi (Lycoadolfi), Lycodes frigidus (Lycofrigid), Lycodes luetkeni (Lycoluetke), Lycodes paamiuti (Lycopaamiu) (could be mistaken for L. pallidus). Size of circle proportional to the number of specimens caught in the station. These are typical deep and cold water species, hardly to be found in the shallow parts of the Barents Sea.
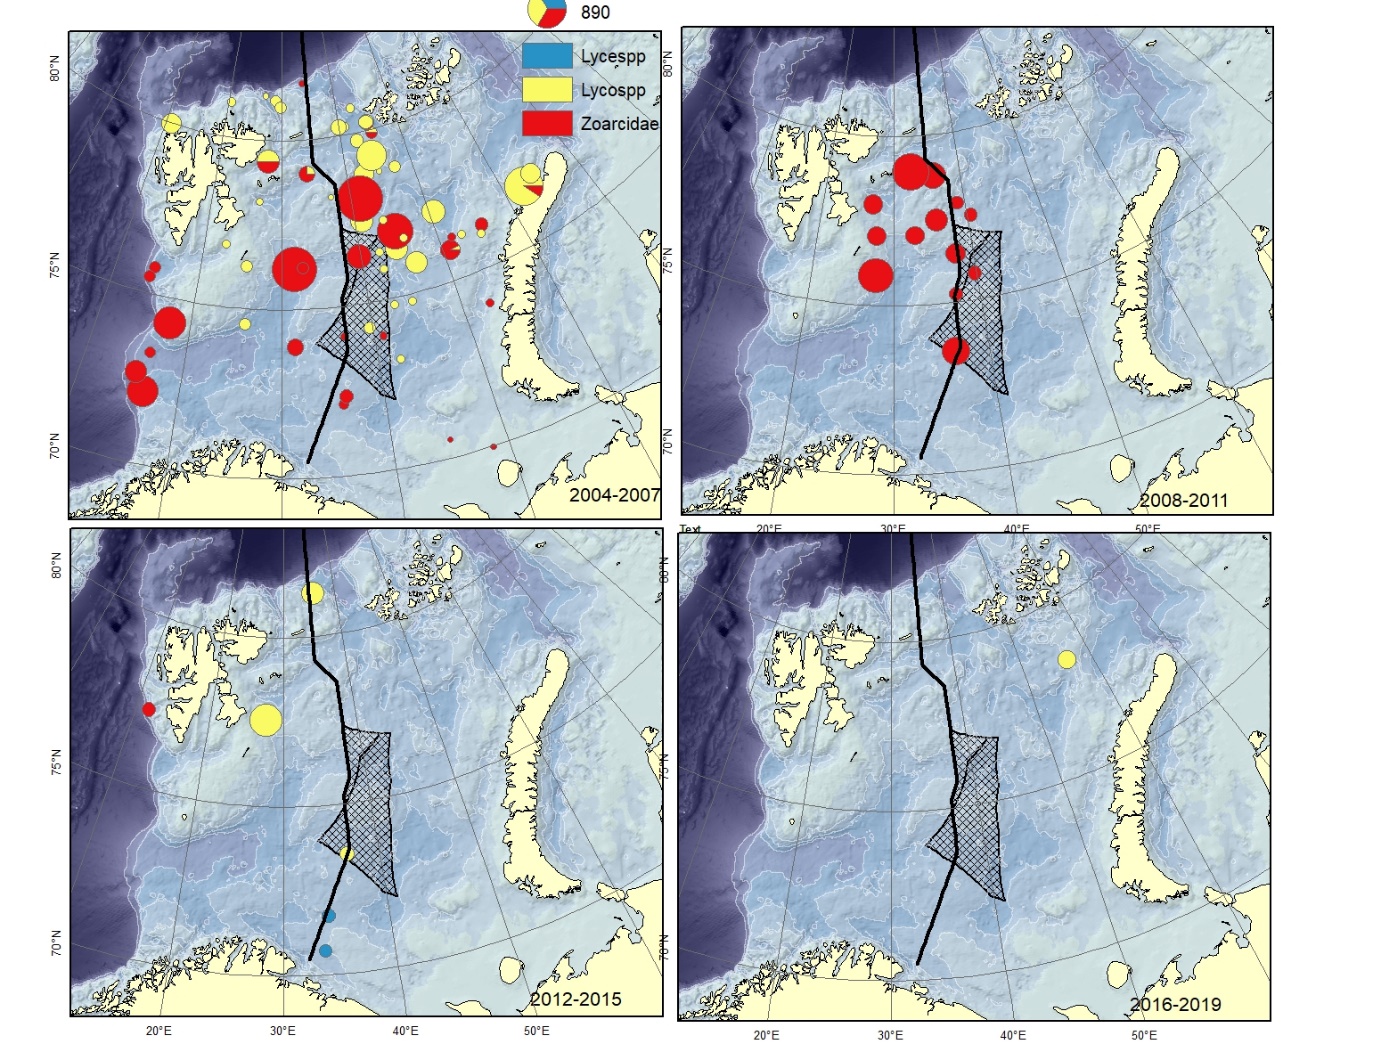
Figure A15. Specimens recorded to the genus ( Lycenchelys spp., Lycodes spp.) or family level (Zoarcidae).