Kameraovervåking av tilstanden til Atlantisk laks i akvakultur har utviklet seg raskt og nye teknologier er i bruk før systematisk validering har blitt utført. Automatisk deteksjon og estimering av antall lakselus på fisk er ett eksempel, der flere produkter tilbys på markedet. For å effektivt erstatte dagens manuelle tellinger av lus behøves en referansestandard for å kunne sammenligne luseestimater fra manuell telling med estimater fra de automatiserte systemene. Dette prosjektet utførte lusetellinger i laksemerder av forsknings- og kommersiell-skala for å undersøke variasjon i lusetall fra manuelle tellinger gitt tellemetode (inkl. fisk i luft. vs. i vann), antall fisk som telles for, feilkilder ved håndtering av fisken (lus som faller av), og samsvar av lusetall mellom manuelle og automatiske tellinger. Standardiserte lusetall på laks gir et høyere antall lus enn vanlige manuelle tellinger, og samsvarer bedre med automatiserte tellinger. En høy korrelasjonskoeffisient mellom standardiserte og automatiserte tellinger ble funnet og kan brukes som en enkel proxy for evaluering. Basert på resultatene, samt kunnskap fra andre kilder, er det utviklet en foreløpig standard prosedyre for standardiserte manuelle lusetellinger som har som mål å redusere unødig variasjon i telleresultater. Faktorer som bør vurderes ved validering av automatiske tellesystemer for lus er beskrevet og diskutert.
Standardisation of manual louse counts for validation of automatic camera systems
— Final report (FHF project 901881)
Report series:
Rapport fra havforskningen 2024-61
ISSN: 1893-4536
Published: 18.12.2024
Updated: 30.11.2025
Project No.: 15997 (HI), and this work was co-funded by the European Union's Horizon Europe Project 10113646 EUPAHW
On request by: Fiskeri- og havbruksnæringens forskningsfinansiering (FHF)
Reference: 901881 (FHF), and 10113646 EUPAHW (European Union's Horizon Europe Project)
Research group(s):
Dyrevelferd
Subject:
Fiskevelferd,
Hav, kyst og fjord ,
Lakselus,
Laks i oppdrett
Program:
Fremtidens havbruk
Research group leader(s):
Lars Helge Stien (Dyrevelferd)
Approved by:
Research Director(s):
Geir Lasse Taranger
Program leader(s):
Robin Ørnsrud
Norsk sammendrag
Summary
The shift toward continuous and more precise monitoring of Atlantic salmon in aquaculture has been rapidly progressing, with new technologies being developed and ready for adoption before systematised validation has been made available. Automatic detection and estimation of salmon lice on fish is one such example, with multiple options now on the market. These systems could replace mandated manual counts, but the switch is hindered by the lack of a reference standard or a consensus in validation procedure. This project used small and large (commercial) scale experiments to quantify the variability and divergence of louse density estimates resulting from regular ‘farmer’ manual counts, standardised manual counts, and automatic systems. Factors affecting louse detection rates during manual counts were also investigated by scoring the same fish using rapid counts in air followed by standardised counts with the fish submerged in a shallow tub, as well as comparing detachment rates among louse stages in the anaesthetic bath. Standardised louse counts on salmon provides a higher number of lice than regular manual counts, and match better with automated counts. A high correlation coefficient between standardised and automated counts was found, and may be used as a simple proxy for evaluation and validation. From those results, and knowledge gathered from other sources, we developed a preliminary standard operating procedure for standardised manual louse counts that aims to reduce avoidable variation in manual counts, while improving repeatability and reproducibility of counts nationally. Considerations and recommendations for the validation of automated louse detection systems are also provided within the standard operating procedure (Rapport fra havforskningen 2024-56).
1 - Introduction
The Norwegian salmon farming industry has potential to expand, but is restricted by legislation that limits allowable biomass based on salmon louse (Lepeophtheirus salmonis) infestation densities and downstream effects on the wild salmonid populations that are impacted by lice exported from farms (Thorstad et al. 2015, Vollset et al. 2017, Kristoffersen et al. 2018, Dempster et al. 2021). Various prevention and control methods are available and widely used (Barrett et al. 2020, Overton et al. 2019), although timely interventions are sometimes hindered by imperfect surveillance of louse levels, meaning new infestations are not always discovered early, and true infestation levels are uncertain.
These issues stem from a reliance on manual sampling of fish from each cage for louse counts. Manual counts are labour-intensive and stressful for fish, meaning that farmers are reluctant to sample more than the minimum weekly requirement of 20 fish per cage (Anon 2012), yielding imprecise estimates of louse levels at the cage and even farm level (Jeong et al. 2021). Moreover, manual counts are vulnerable to systematic underestimation of true louse levels, as (1) some lice are lost when fish are collected for manual counts, especially because crowding and/or netting is involved, and (2) some remaining lice, especially sessile stages, are not detected during cage-side counts in sub-optimal conditions. Finally, all feasible collection methods are likely to sample unrepresentatively in one direction or the other, for instance, if fish near the surface are most likely to be captured but also have higher or lower louse levels than the average fish in the cage (Bui et al. 2016).
In recent years, several companies have developed computer vision systems that can automatically detect, classify and enumerate lice on salmon within sea cages, potentially avoiding many of the issues with manual counts. These systems are designed to be deployed continuously, yielding real-time data on infection levels among a much larger and more representative proportion of the cage population than could be achieved using manual counts, while in most cases, also providing insights into other fish health and production metrics (such as size distribution and external welfare indicators).
Currently, farmers who invest in these systems must apply for a special dispensation from the Norwegian Food Safety Authority before reporting automated counts in place of manual counts. From one perspective, this is positive, as it ensures that some level of caution and quality control is applied to the adoption of a technology that is likely to have significant impacts on louse management. However, it also means that access to a potentially superior approach is restricted to those that have the resources to develop and implement a validation protocol (Mattilsynet 2023).
The validation of automated louse counting systems in commercial farm settings is complicated by the lack of a good benchmark against which to compare the automated counts. At the beginning of this project, all existing dispensations had been granted on the basis of high agreement between automated counts and manual counts conducted in the same cages. However, given the low precision and bias inherent in manual counts, both of which are exacerbated by inconsistent methods for manual sampling at different sites and companies, automated louse counting systems that are tuned to match manual counts are likely to underestimate true louse levels to varying degrees, simply because the manual counts against which they are benchmarked also underestimate true louse levels.
While automated systems offer more representative sampling of large cage populations, accurate classification of louse stages could present an obstacle. Current legislation requires farmers to report salmon louse stages grouped into 3 categories: sessile lice (copepodids, chalimus 1, chalimus 2), mobile lice (pre-adults 1 and 2, adult males) and adult females. Automated louse counting systems are unlikely to be able to accurately identify and enumerate sessile stages, which do not contribute to treatment thresholds (which predominantly apply to adult female abundances) but do have implications for management strategies and forecasting of outbreaks. Similarly, the current generation of automated systems may not reliably distinguish Caligus elongatus from mobile L. salmonis resulting in false positives of the latter; C. elongatus are not yet required to be reported to authorities but may be in the future.
A validated standard is needed for benchmarking of automated louse counts against manual counts, ensuring that all farmers and technology providers are on a level playing field when it comes to the granting of dispensations and reporting of louse levels. In this project, we identified some biases and their contribution to the method's measurement uncertainty at small and full commercial scale, and compare the results from manual counts to those from an automated system (this report). Based on these findings and information from other sources, we provide some considerations that can be useful when developing a validated method for automated louse counts (Standard operasjonsprosedyre for manuell lusetelling til validering av automatisk telling, English version included: A Standard Operating Procedure for validation of automatic louse counts). We hope that these considerations and the supporting data will serve as a useful starting point leading to the development of a national standard for louse counting.
Project relevance and how results may be utilised
The current practice of netting and physically assessing salmon to report infection levels is time-consuming, sub-optimal for fish welfare, unrepresentative of the whole cage population’s status, and carries huge uncertainty due to inconsistent sampling methods and influencing factors such as weather conditions. With immense pressure to control louse infections on farm, continuous automated monitoring of infection levels is key to sustainable and successful parasite management. Today, Mattilsynet requires documentation of validation to grant dispensation for their use, and the methods used in successful applications have not been shared. This project provides experimental evidence for characterising sampling uncertainty (i.e. through sample size, sample method, and staging accuracy) and provides a framework for validation that a stakeholder could apply any automatic monitoring systems for use of their own facilities. The short project duration means that the deliverables could immediately be available to the industry for implementation.
The SOP will also ensure that the applications to Mattilsynet are scientifically-sound and can reduce the need to utilise third parties when processing applications from the different suppliers. The SOP can also guide potential new product developers on validation and eventual approach for approval for use. This can ensure healthy competition between suppliers that will encourage each supplier to provide the most reliable data, and the industry overall will have better control over the louse situation. It is important that the SOP does not put shackles on future development of automatic monitoring systems, as this is new technology that will continuously improve in accuracy over time, but instead facilitates continual verification of updated versions. There is currently a fear among some farmers that if they use an automatic louse counting system, they will count more lice (i.e. systems will detect more lice than from manual counts), and hence need to delouse earlier than if they had only counted manually. It is crucial that overall, louse numbers in cages are as accurate as possible to be able to provide the best measures overall in the industry. With refinement of the SOP, the standard could provide more permanent acceptance of automated systems and guide the industry away from sole reliance on manual counts. With more farms being allowed to use continuous monitoring systems, a greater surveillance effort will be possible across regions, which has implications for accuracy of the louse dispersal model, the possibility of forecasting infection pressure, and understanding infection dynamics among production zones.
Project organisation
This project aimed to address the development and documentation of a reference standard for automatic louse counting systems, and was conducted in 2023-2024 as a collaboration between Havforskningsinstituttet, Deakin University (Australia), OptoScale AS and Kobbevik og Furuholmen Oppdrett AS. The project group included: Samantha Bui (HI), Velimir Nola (HI), Ole Folkedal (HI), Luke Barrett (Deakin Uni.), Ingar Stian Nerbø (Optoscale AS), Ragnhild Hollup (Optoscale AS), Ivar Bergstø (Kobbevik og Furuholmen Oppdrett AS).
The project also ran in parallel with another that focused on the external factors that could influence automatic louse counting systems, led by Birger Venås at Sintef Ocean - Ytre faktorers påvirkning på bildebasert luseregistrering, basert på en anonymisert sammenligning av teknologier i felt: Et kunnskapsbidrag til ny standard (TELLUS; FHF project 901882). This project was funded by the Norwegian Seafood Research Fund (fhf.no), with a reference group consisting of Birger Venås (SINTEF Ocean), Leif Magne Sunde (SINTEF Ocean), Else Marie Stenevik Djupevåg (Mattilsynet), Eskil Bendiksen (Bjørøya AS), Svein Andorsen (Ellingsen Seafood AS), Magne Aldrin (Norsk Regnesentral), Kari Thyholt (NCE Aquatech cluster), and Eirik Ruud Sigstadstø (FHF observer). This work was co-funded by the European Union's Horizon Europe Project (10113646 EUPAHW).
2 - Methods
To inform the development an SOP, new data were collected via two dedicated trials, the first at small scale (12×12 m steel cages) and the second at full commercial scale (158 m diameter circle cages). All automated louse counts were provided by OptoScale (Trondheim: https://optoscale.no). To address other relevant factors for the SOP (e.g. collection method, data quality), we looked to concurrent projects, reports, and the limited literature available.
2.1 - General methods
2.1.1 - Regular ‘farmer’ counts
Sampling protocols vary among farms and farming companies, and will likely contribute to uncertainties and biases in louse density estimates (Table 2). For the purposes of this study, we conducted the ‘farmer’ counts following a protocol that approximates those used by most farming companies (Solberg et al. 2018, Thorvaldsen et al. 2019). Fish were collected from the sea cage and anaesthetised according to site-specific methods (see methods for ‘Small scale trial’ and ‘Large scale trial’ below). Once sufficiently anaesthetised to permit handling and minimise stress, individuals were held out of water and a relatively rapid (<30 s) count of sessile, mobile and adult female classes was performed by Havforskningsinstituttet (HI) technicians before the same individuals were counted again using the standardised count method (see below). This enables a comparison of detected lice on the same individuals according to counting method, and was conducted for 20 fish per cage in both the small and large scale trials. For the large scale trial, the mandatory cage-level weekly count data was also made available (conducted by the KF farm staff on 10-20 fish, depending on the mandated minimum at the time). These farmer counts are analysed separately to the rough counts performed by HI staff. The HI counts took place in intervals of ~4 weeks, while automated estimates were generated daily but with some missing days when delousing was underway.
2.1.2 - Extended ‘standardised’ counts
In addition to the regular farmer counts, we conducted a set of counts using a more rigorous protocol that is typically applied within scientific investigations, as taught and certified by HI for standardised counting in the national surveillance program for wild salmonids. We have termed this more extensive method standardised counts. Once anaesthetised, fish were transferred by hand onto a length measurement board mounted on a benchtop weighing scale to allow simultaneous recording of individual length and weight, and then transferred again by hand into a plastic tub filled to 15 cm depth with ambient seawater (pumped from 1 m depth) and containing more anaesthetic. Louse counts and welfare assessments were conducted on one fish at a time by trained personnel (certified according to HI’s protocol for counting and classification of lice on Atlantic salmon) using a >1000-lumen LED headlamp (Petzl Duo S or similar) and forceps/tweezers. Counting in seawater aids in detection of lice, especially sessile stages, by removing surface tension and reflections from the surface of the fish. The headlamp ensures sufficient and more consistent lighting conditions. Forceps allow lice to be removed from the fish and placed on a white background to avoid double counting and aid in classification of stage and sex. Once the target sample size of fish had been reached, the anaesthetic tank was drained and rinsed with a sieve (1 mm mesh) under the outflow to collect any mobile louse stages that detached during anaesthesia. Sample size was 100 fish per cage for the small scale trial, and 60 fish per cage for the first 3 samplings for the large scale trial followed by approximately 30 fish per cage for the last. The sample size was reduced for practical and logistical reasons after it was determined that the benefits of larger sample sizes were sufficiently demonstrated by the data collected to that point, and that n = 30 fish offered sufficient precision for comparison of regular farmer manual, standardised manual, and automated counts.
2.1.3 - Automated counts
One camera system per cage (Bioscope, Optoscale AS, Trondheim, Norway) was positioned according to supplier’s recommendations to attain a high frequency of images of fish throughout the day and night. In practice, this meant that cameras were positioned midway into the cage radius where the typical torus-shaped school is concentrated, while depth was adjusted according to the predominant swimming depth of the school, which varied in response to seasonal changes in temperature and light.
The measurement system consists of an underwater housing equipped with a stereo camera system for three-dimensional imaging, a high-resolution colour camera dedicated to louse detection, and two dimmable LED lights (Fig. 1). The automatic louse counting method operates in several steps. First, the image streams from the cameras are monitored, and fish are detected and cropped using deep learning-based object detection algorithms. The distance to each detected fish is then calculated using stereo imaging to ensure it falls within the depth of focus. Images are subsequently evaluated for adequate image quality to facilitate accurate louse detection.
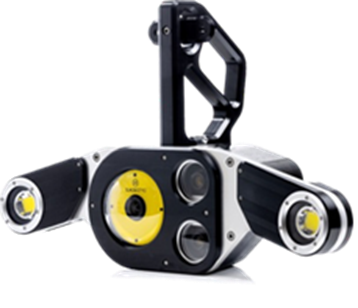
A louse detection model is applied to identify the positions and sizes of three louse classes: adult female salmon lice, mobile salmon lice, and Caligus elongatus. The fish are segmented from the background to determine their outlines; any louse detections located outside a fish's outline are discarded, as they are presumed to be attached to other fish. Louse detections overlapping the outline are on the edge and may also be detected from the opposite side. Louse detections entirely within the fish outline are counted twice to account for the side of the fish not visible to the camera, under the assumption that louse distribution is uniform on both sides.
Fish within images were automatically scrutinized for lice and daily estimates of mobile, adult female and C. elongatus levels per cage group was continuously updated in suppliers web portal. Two different object detection models for louse detection were tested. One basic algorithm, built for and assuming high underwater visibility (high-visibility detector), and another assuming challenging visibility (low-visibility detector).
2.2 - Small scale trial (Sauaneset)
The first trial was conducted at Sauaneset I in the Austevoll municipality (locality 13035, Institute of Marine Research) during Aug–Nov 2023. Sauaneset is a sheltered outer fjord location with minimal stratification of the water column. The sea temperature at 5 m depth declined from 15 to 11 °C through the trial, with ~34 ppt salinity throughout. The site layout consists of a central gangway providing vehicle access to 2 rows of 8 square steel cages (12×12 m, 14 m net bottom). The trial utilised 4 randomly allocated cages, each containing ~3000 Atlantic salmon from the same cohort (mean ± SD at first sampling: length = 47.4 ± 4.3 cm, weight = 1349 ± 353 g). Fish were not deloused prior to experiment start, to ensure adequate louse abundance for the observation period. OptoScale Bioscope modules were installed in the cages (1 per cage) prior to experiment start.
Fish were captured for manual counts using a rectangular seine net (12 m long x 7 m deep) with surface floats along the top line, via the following steps: (1) Lower the net midway into the cage. (2) Throw pellets by hand onto the water’s surface on one side of the lowered net to attract fish. (3) Haul the bottom of the seine net up and toward the cage wall by manually pulling ropes attached to the bottom corners of the net, and then haul the net’s floatline toward the same net wall, gently crowding the fish close to the surface against the cage wall. (5) Transfer fish by individually dip-netting them into a tank (1 m3) filled with ambient seawater (pumped from 1 m depth) and anesthesic solution (benzocaine: Benzoak Vet.). Fish were left there for 1-2 min until loss of equilibrium was achieved; at which point fish were removed and assessed for lice according to either the rapid, in-air method or standardised protocols (detailed above in ‘General methods’). The anaesthetic solution was replaced at regular intervals to maintain efficacy and oxygenation, with the outflow sieved (1 mm mesh) to collect any mobile lice that detached during anaesthesia (preliminary results from FHF project 901784 ‘LuseOppsamlingSjø’ indicate that this mesh size will collect most or all mobile lice: Barrett et al., in prep.). After the target sample size of fish had been reached for a given cage, the anaesthetic tank was emptied through a sieve and a thorough examination of the tank conducted to detect any lice that had attached to the tank walls.
2.2.1 - Statistical analysis
Model 1: Effect of manual counting method (HI farmer vs. HI standardised) . This model was fitted to the simulated farmer counts (rapid in-air counts) and standardised counts conducted by HI staff. A generalized linear mixed model (GLMM) was fitted to fish-level louse counts using the glmmTMB package for R (Brooks et al. 2017), with fixed effects for louse class (4 levels: sessile, mobile, and adult female salmon lice; and C. elongatus), counting method (2 levels: fish held in air for a rapid count or in water for a standardised count), and sampling date (2 levels: Samples 2 and 4). We included class × method and class × sample interactions, as the importance of the counting method is expected to differ between louse classes, and densities of louse classes are expected to differ between sampling dates. A random intercept term for cage identity was included to account for repeated measures within the same cage. A Poisson model family provided the best fit as assessed using diagnostic tools from the DHARMa package (Hartig 2019). The model was interpreted using type II analysis of variance (car package: Fox and Weisberg 2019) and marginal predictions extracted and plotted using the ggeffects (Lüdecke 2018) and ggplot2 packages (Wickham 2016).
Model 2: Effect of sample size on the cage mean density estimate. This model was intended to test for systematic (directional) shifts in the cage mean with increasing sample size, as would be expected if the first fish collected tended to have higher or lower louse loads than those that followed. The standardised count dataset was grouped by date and cage, and then ordered by fish number, from fish 1 (first sampled) to fish 100 (last sampled). We then calculated a cumulative cage mean as each new fish was added (based on attached lice only, not those that detached in the anaesthetic tub), where the sample size was equal to fish number. A Tweedie GLMM was fitted to compare the estimated mean density after 20 and 100 fish. The response variable, cumulative cage mean, was predicted by fixed factors for louse class (4 levels: sessile, mobile, and adult female L. salmonis; and C. elongatus ) and sample size (2 levels: 20, 100), with a random intercept term for cage identity to account for repeated measures. This model was assessed and interpreted the same as for Model 1.
2.3 - Large scale trial (Brattavika)
Following the small scale trial, a full commercial scale was conducted at Brattavika, also in the Austevoll municipality (locality 11488, Kobbevik og Furuholmen Oppdrett AS) from Jan-Apr 2024. Brattavika is situated in an outer fjord channel with minimal stratification but with stronger tidal and wind-driven currents than Sauaneset. The sea temperature at 5 m depth ranged from 4.6–16.4 °C through the trial, with ~34 ppt salinity throughout. The site consists of 2 rows of 5 circular sea cages (158 m circumference, cone shaped net with bottom at 50m) connected to a feed barge. The trial was conducted in 4 randomly allocated cages.
Fish were captured for manual counts using a lift net (glip in Norwegian), consisting of a 3-m-deep cone-shaped net supported by a circular steel ring (2.5 m diameter) and suspended from a central rope. Fish collections and louse counts were conducted aboard the site’s workboat via the following steps: (1) Lower the lift net to 30 m depth; (2) Throw pellets by hand onto the water’s surface above the lift net to attract fish; (3) Winch the lift net vertically (approx. 1 ms-1) until the steel ring is ~50 cm above the surface, gently crowding the captured fish within the net cone. The fish were then individually dip-netted into an anaesthetic tank and assessed following the same protocol as the Sauaneset trial (detailed above).
2.3.1 - Statistical analysis
Model 3: Effect of manual counting method (KF farmer vs. HI standardised). This model compared cage-level estimates from regular weekly counts (provided by farm staff) with those from standardised manual counts (conducted by HI staff). As there were many sampling dates at Brattavika, with farmer and standardised counts often not conducted on the same day, a series of generalized additive models were fitted, which allowed infestation densities estimated by each method to be smoothed and compared through time. To limit model complexity and to fully account for differences between cages, we fitted separate models for sessile, mobile and adult female L. salmonis within each cage. Each of the models were specified the same way using the mgcv package (Wood 2011, Pedersen et al. 2019), with a smoothing term for day (grouped by counting method) and a Tweedie model family. Fits were assessed using the gam.check and summary.gam functions, with predictions extracted and plotted as for Model 1.
Model 4: Effect of manual counting method (HI farmer vs. HI standardised). This model was fitted and interpreted identically to Model 1, but with differing louse classes (5 levels: sessile, small mobile, pre-adult female, adult male, adult female) and a nested random intercept term to account for repeated measures within the same cage (sampling date nested within cage identity).
Model 5: Effect of sample size on the cage mean density estimate. This model was fitted and interpreted identically to Model 2, except that C. elongatus were rare at Brattavika and therefore only three louse classes were fitted (sessile, mobile and adult female L. salmonis), and because a smaller number of fish were sampled at Brattavika (range 26–62, median 60 fish), the mean density estimate was compared after the 20th and final (usually 60th) fish.
Model 6: Detachment rates of lice in anaesthetic tub . A beta-binomial GLMM was fitted to proportional detachment rates, where a replicate was a single tub (one tub per cage per sampling date). To meet the assumptions of the beta-binomial distribution, we applied a transformation to remove 0s and 1s: 𝑦 𝑡 = (𝑦 ∙ (𝑛 −1) + 0.5) / 𝑛, where y is the raw proportion and n is the sample size of lice. The model was then fitted with a single fixed effect (louse class) and a random intercept term for sampling date nested within cage identity.
3 - Results
3.1 - Small scale trial
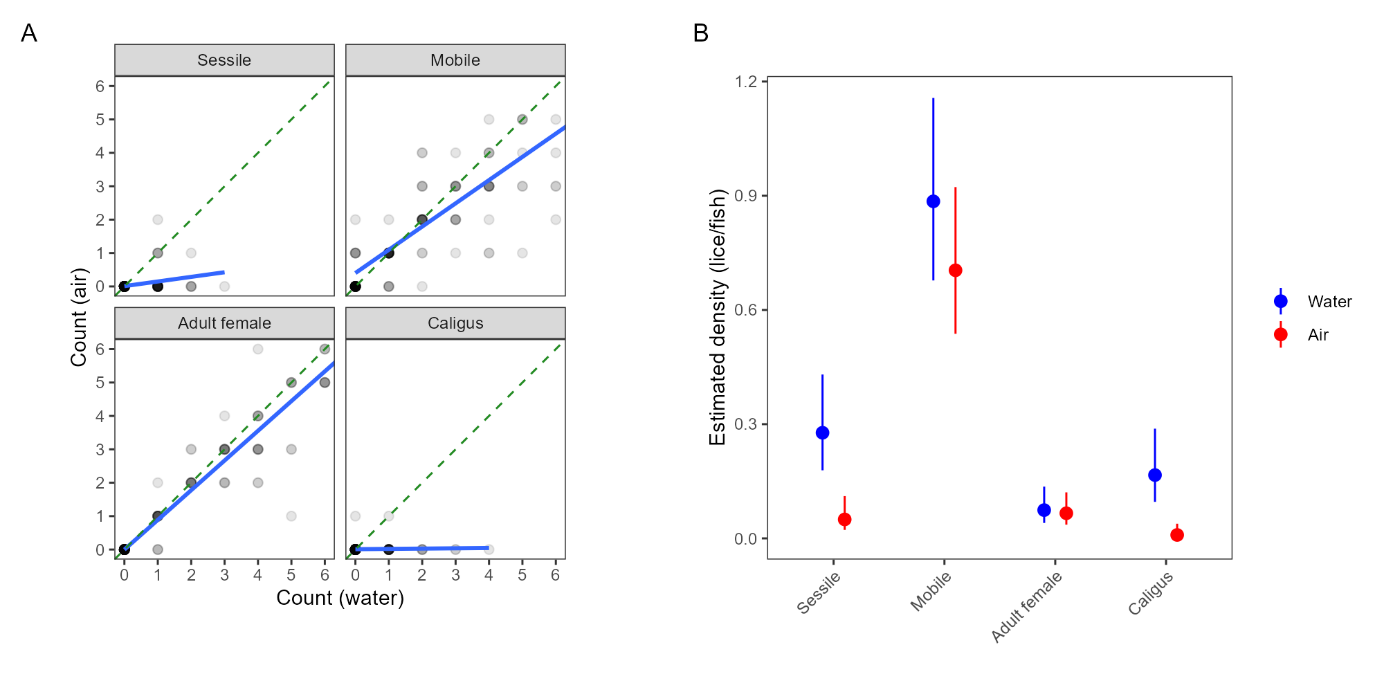
There was a substantial difference in louse detection rates depending on whether the fish was held in the air for a rapid count (simulating a regular ‘farmer’ count) or submerged in a shallow tub following the ‘standardised’ protocol (Model 1; Table A1). Marginal predictions indicated that 5.6× more sessile salmon lice, 1.27× more mobile salmon lice and 17× more C. elongatus (with high uncertainty due to very low densities overall) were detected when fish were held in water for counts, while there was a negligible difference for adult female salmon lice (Fig. 2).
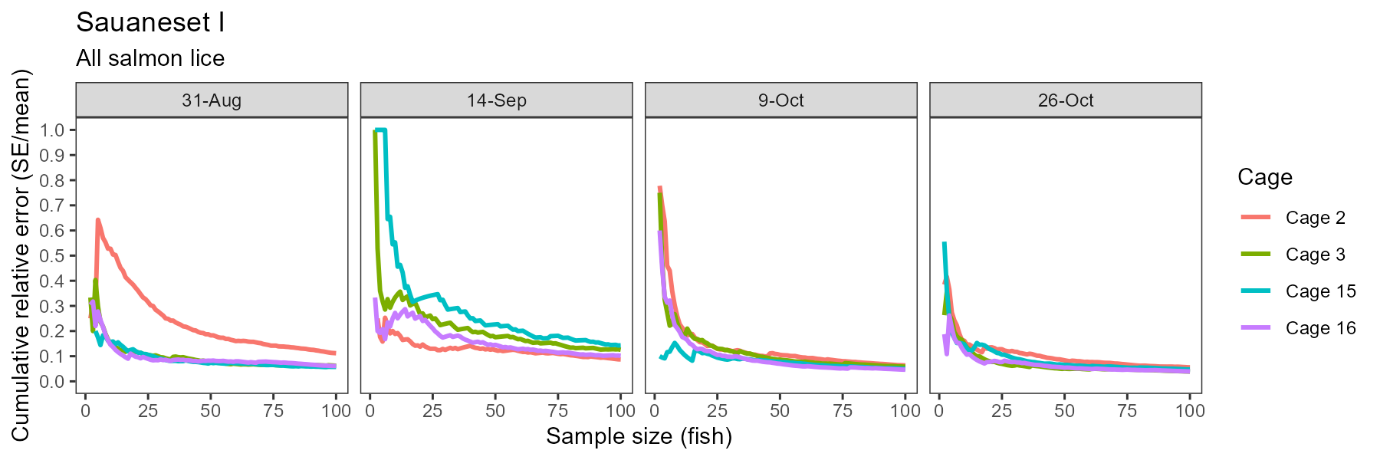
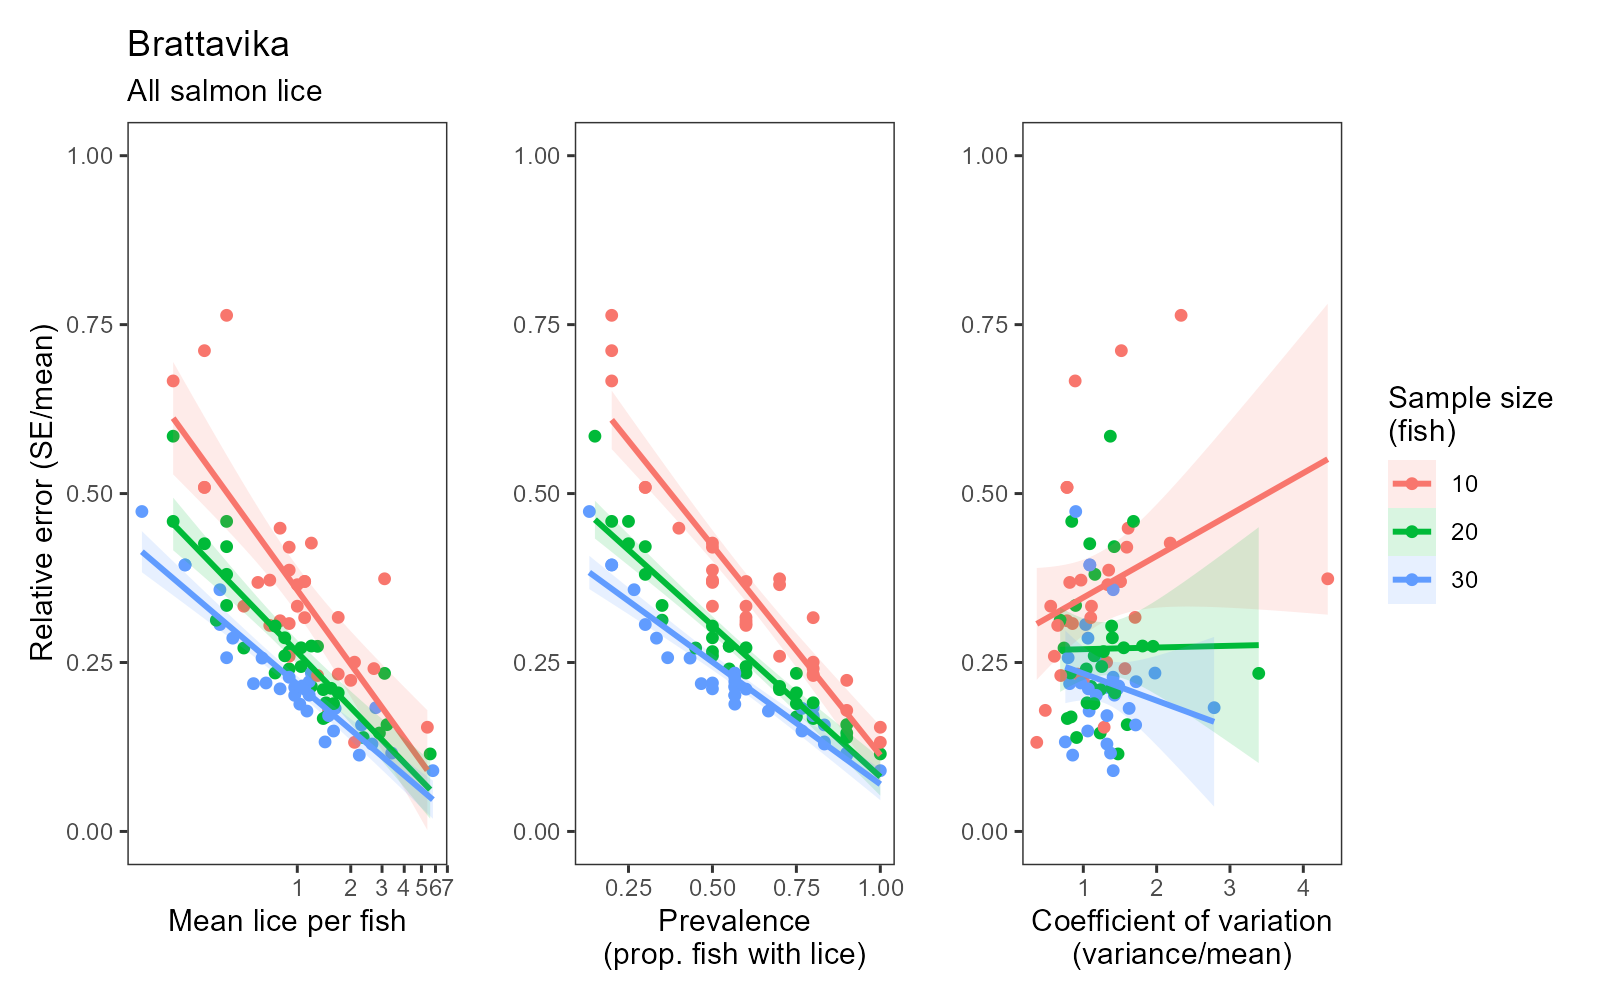
Consistent with statistical theory, confidence in the estimated infestation density improved with sample size, indicated by smaller standard errors relative to the mean at larger sample sizes. This effect was more pronounced but also more erratic at small sample sizes (e.g. <20 fish) as outlier individuals had a relatively large influence on the sample mean and variance. However, moving from a sample size of ~20 fish up to 100 fish produced a more consistent and approximately negative exponential reduction in relative error with increasing sample size (Fig. 3). Averaged across all cages and sampling dates, the standard error was 22.8% of the mean with 10 fish, 16.6% with 20 fish, and 13.4% with 30 fish.
There was no evidence for a systematic shift in estimated cage means with increasing sample size (Model 2, Table A1), indicating that the first 20 fish sampled at Sauaneset for standardised counts were broadly representative of the following 80 fish, assuming similar rates of louse loss in the anaesthetic tub. However, a sample size >20 may still be preferable to improve the precision of the estimate.
3.2 - Large scale trial
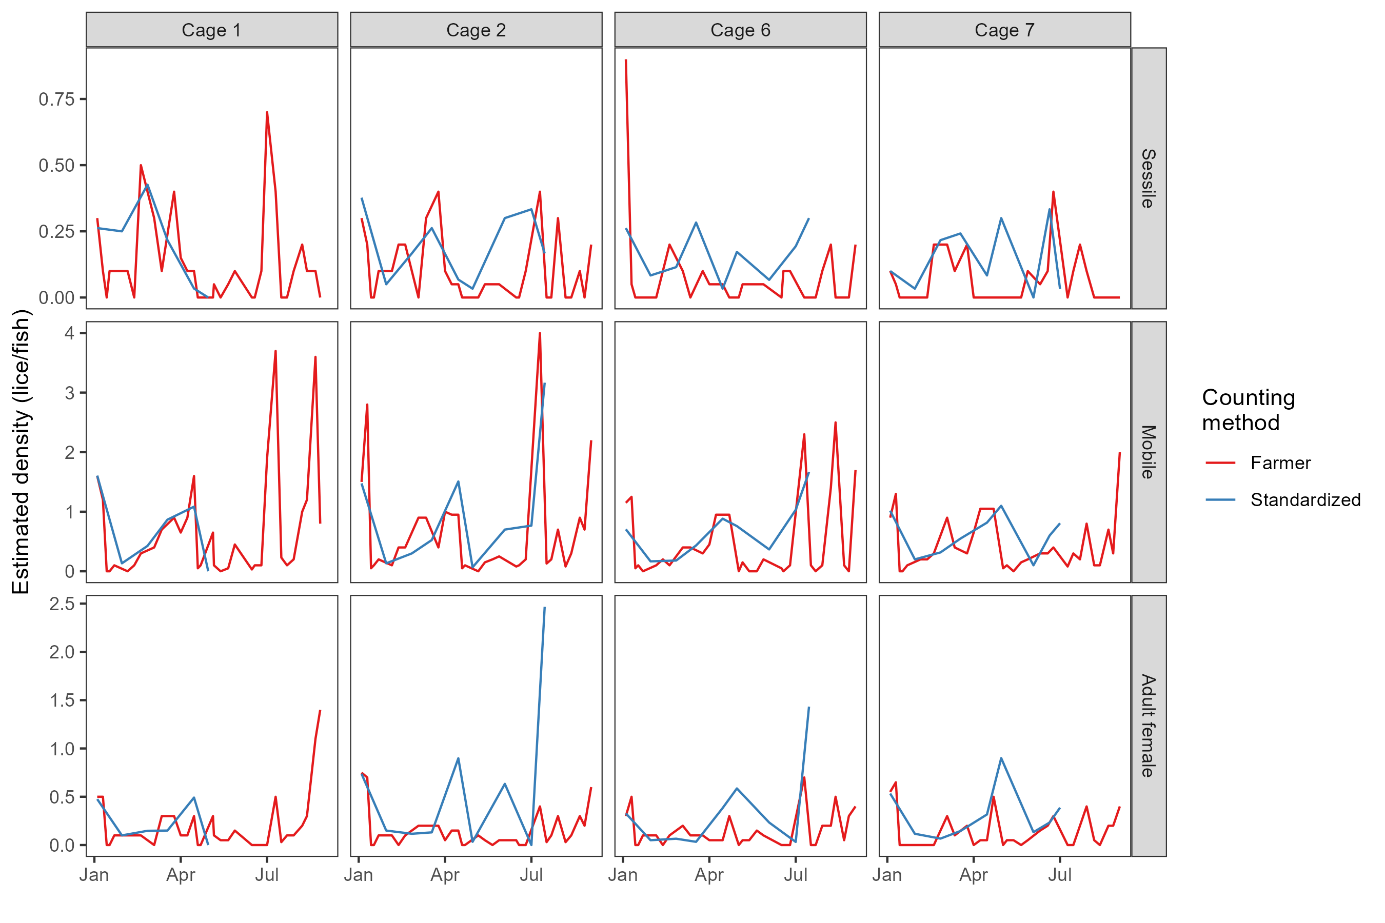
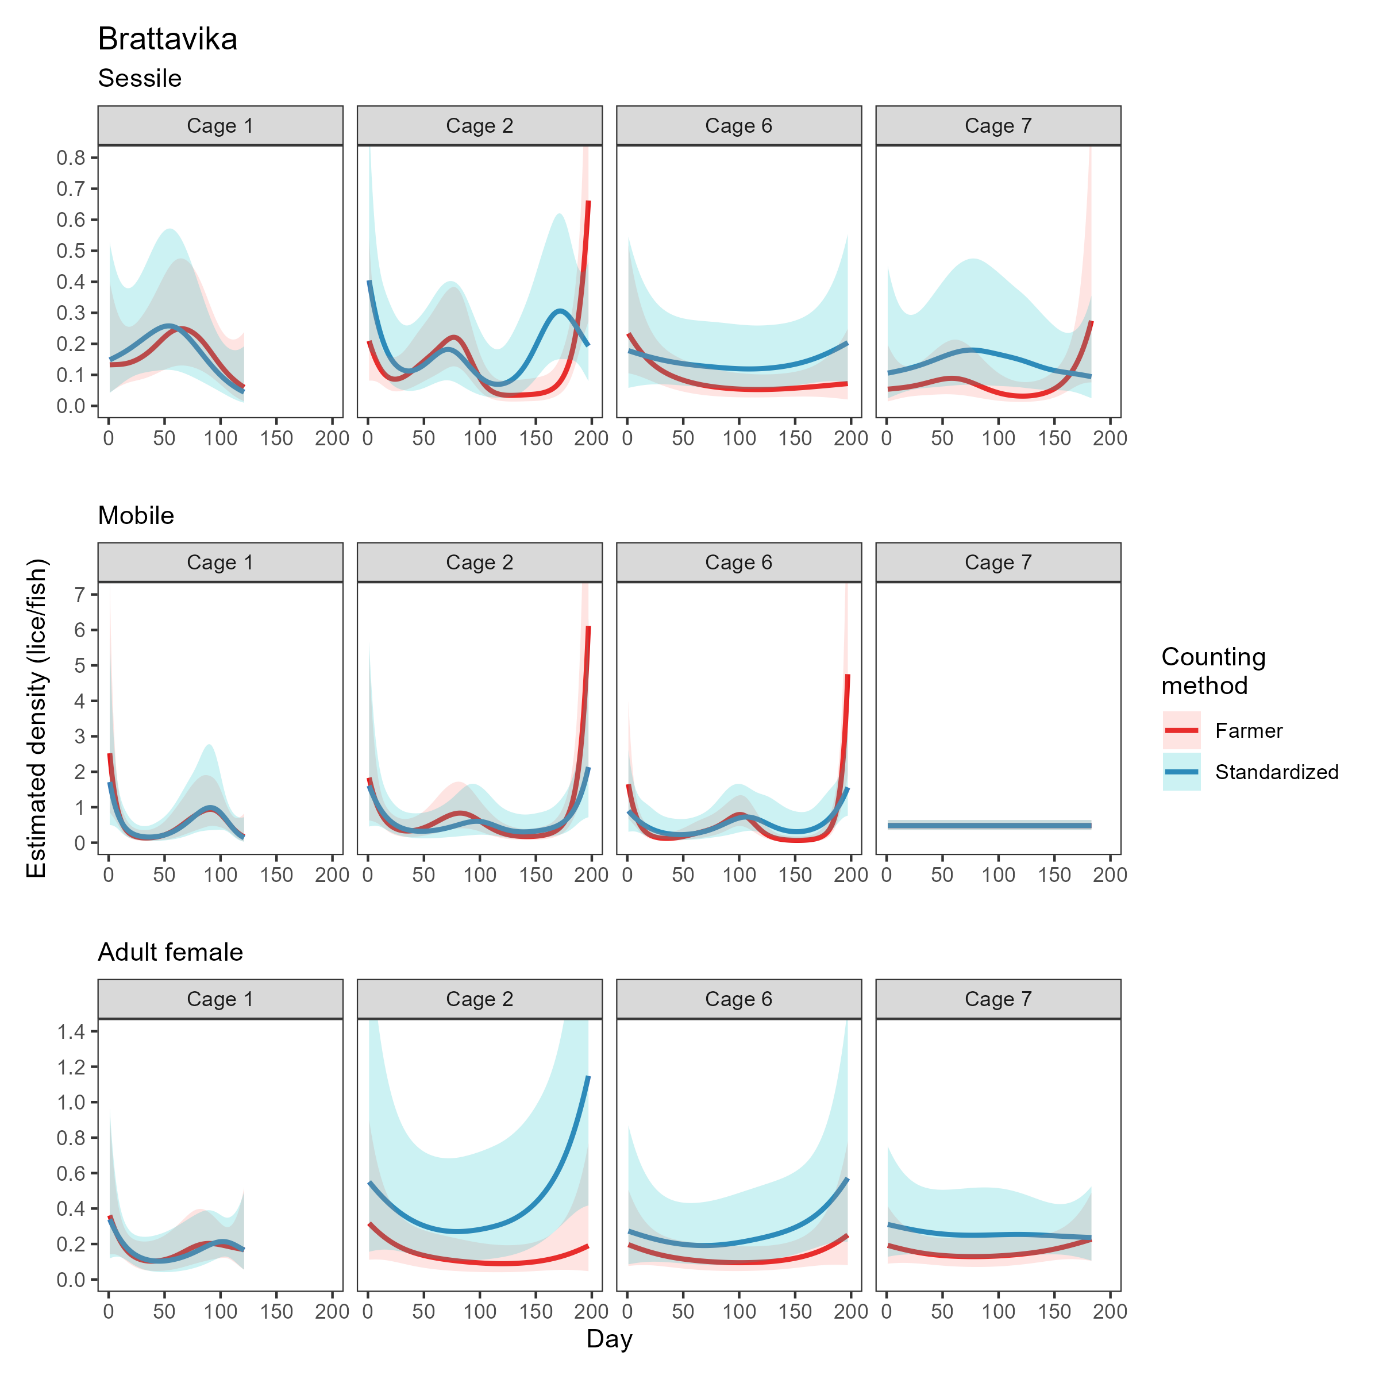
Site-wide infestation densities fluctuated through the trial in response to seasonal temperature and lice treatments (Model 3, Table A2), and also varied substantially between cages. The cage-level generalized additive model fits based on farmer counts (mandatory weekly counts conducted by farm staff) and standardised counts (conducted by HI staff) were broadly in agreement, with periods of increasing or decreasing louse densities generally evident in both datasets (Figs. 4, 5). There were small differences in the timing of inflection points and some divergence at the end of the time series (Fig. 5), which are likely attributable to differing sampling days among methods and cages causing differing resolution at certain times. Overall, the infestation density estimate based on standardised counts was almost always higher than the estimate based on farmer counts, and there were extended periods where the estimate based on farmer counts was outside—and usually below—the 95% confidence interval of the estimate based on standardised counts (Fig. 5).
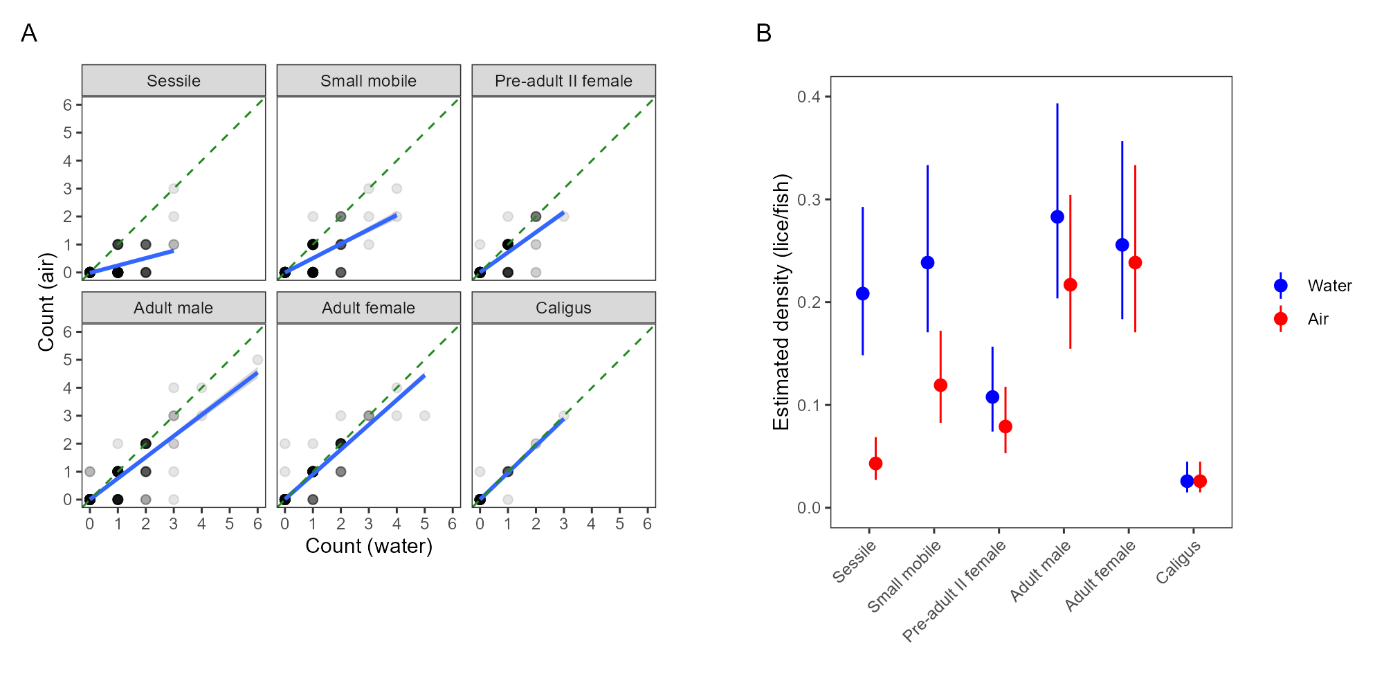
As was done in the small scale trial, we also compared detection rates based on simulated ‘farmer’ counts (rapid counts in air by HI staff) and ‘standardised’ counts for which the fish was held in shallow water. There was a positive correlation between the farmer and standardised counts, but not a 1:1 ratio, indicating that rapid counts in air tended to miss lice that were detected using the standardised in-water method (Fig. 6). Model 4 revealed a strong interaction effect between louse class and counting method (Table A2), such that the effect of counting method is strongest for smaller louse classes. In other words, standardised counts detect more lice than farmer counts overall, but the difference in detection rate is greatest for smaller life stages, which are easily missed when counts are conducted in air or without close scrutiny, even when trained personnel are used (Fig. 6).
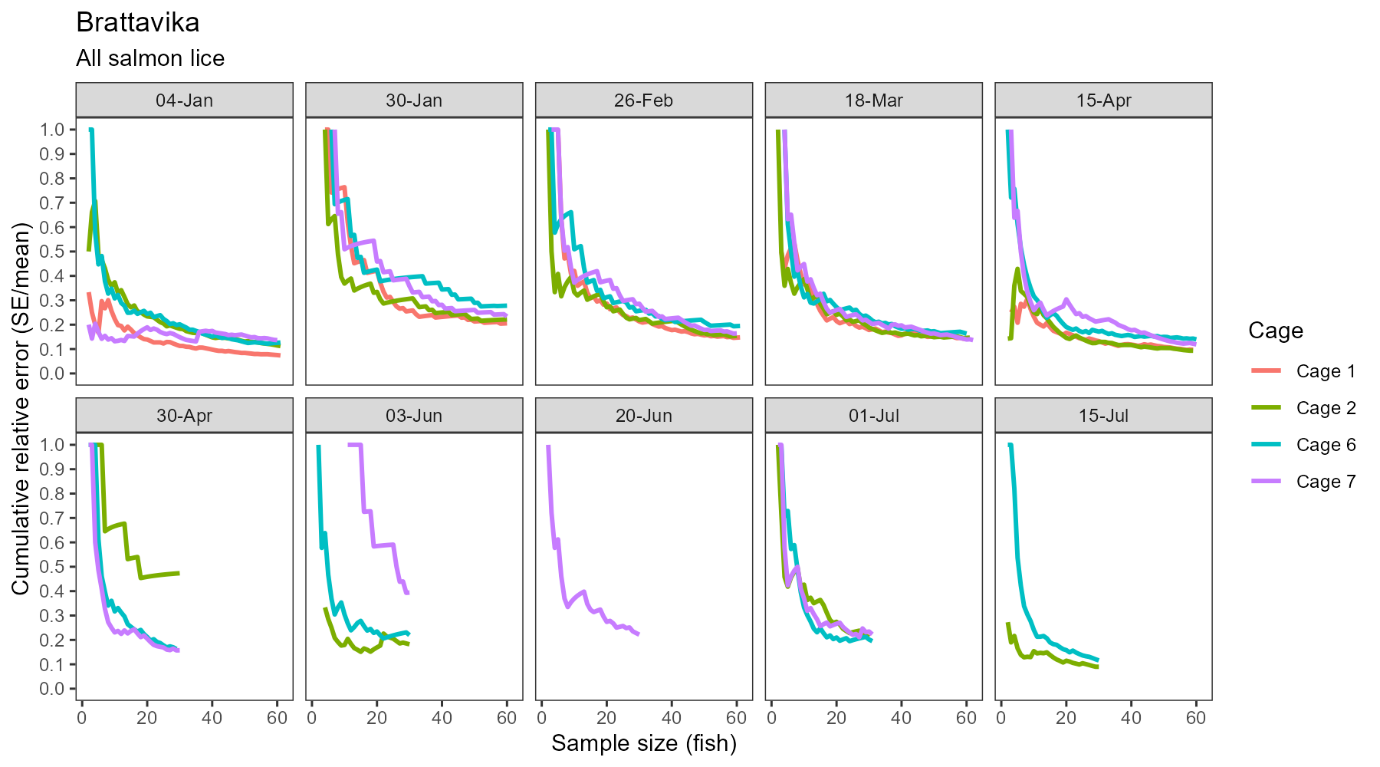
Confidence in the estimated infestation density improved with sample size at Brattavika in a similar pattern to that observed in the small scale trial, namely, an approximately negative exponential decline in the standard error relative to the mean with increasing sample size (Fig. 7). Averaged across all cages and sampling dates, the standard error was 36.1% of the mean with 10 fish, 27.0% with 20 fish, and 22.2% with 30 fish.
As with the small scale trial, there was no evidence for a systematic shift in the estimated cage mean infestation density when the sample size was increased from 20 to ~60 fish (Model 5, Table A2).
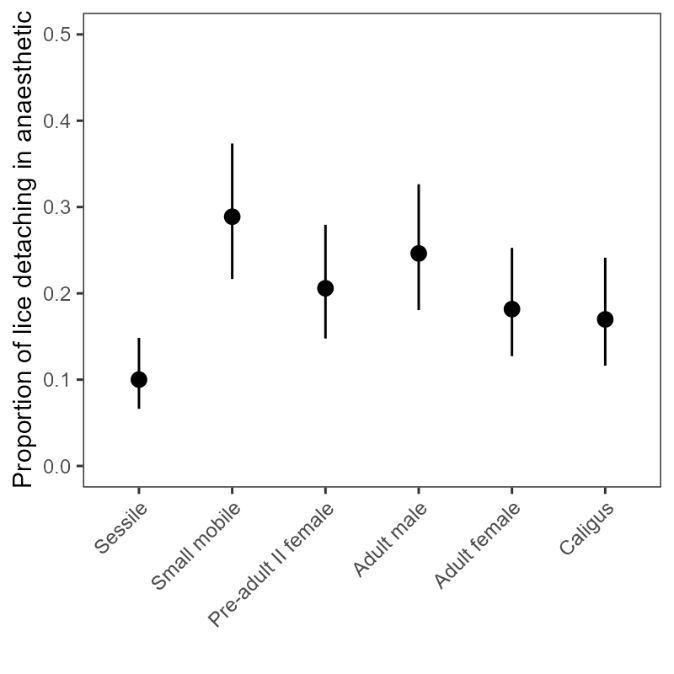
Finally, we quantified loss rates in the anaesthetic tub during the standardised counts at Brattavika. Model 6 revealed a significant effect of louse class on detachment rates (Table A3), with sessile lice having the lowest rate of detachment (10%) and small mobile lice (pre-adult I male and female, pre-adult II male) having the highest (29%) (Fig. 8). There was some evidence that among the mobile classes of L. salmonis, detachment rates decreased with increasing size, while C. elongatus had similar detachment rates to adult female L. salmonis (Fig. 8).
3.3 - Automated louse count
Four underwater camera systems were used to monitor the number of lice per fish in the small scale trial (12x12 m cages) from Aug-Nov 2023, and in the large scale trial from Dec 2023 to Aug 2024. Except for shorter breaks around delousing operations, daily lice numbers were collected over a full year, allowing the comparison of automated and manual counts over a range of field conditions:
-
All four seasons, with realistic water visibility and weather variations
-
Salmon louse abundance from 0 to 7 adult females per fish, including several delousing operations
-
Fish with average weight ranging from 1 to 4 kg
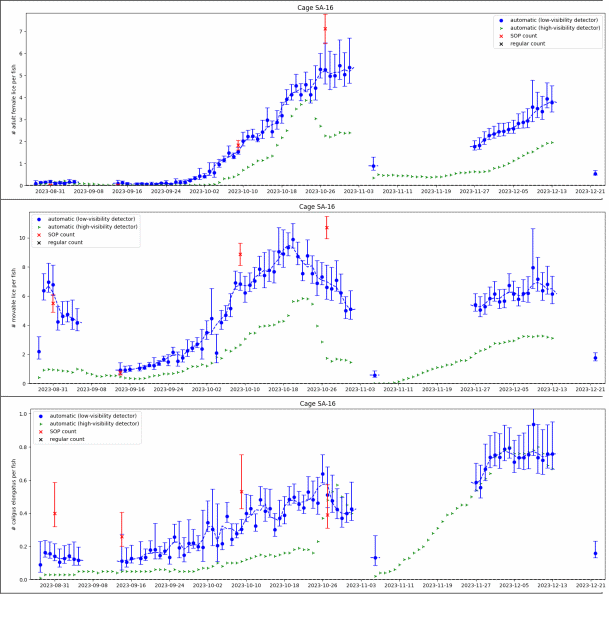
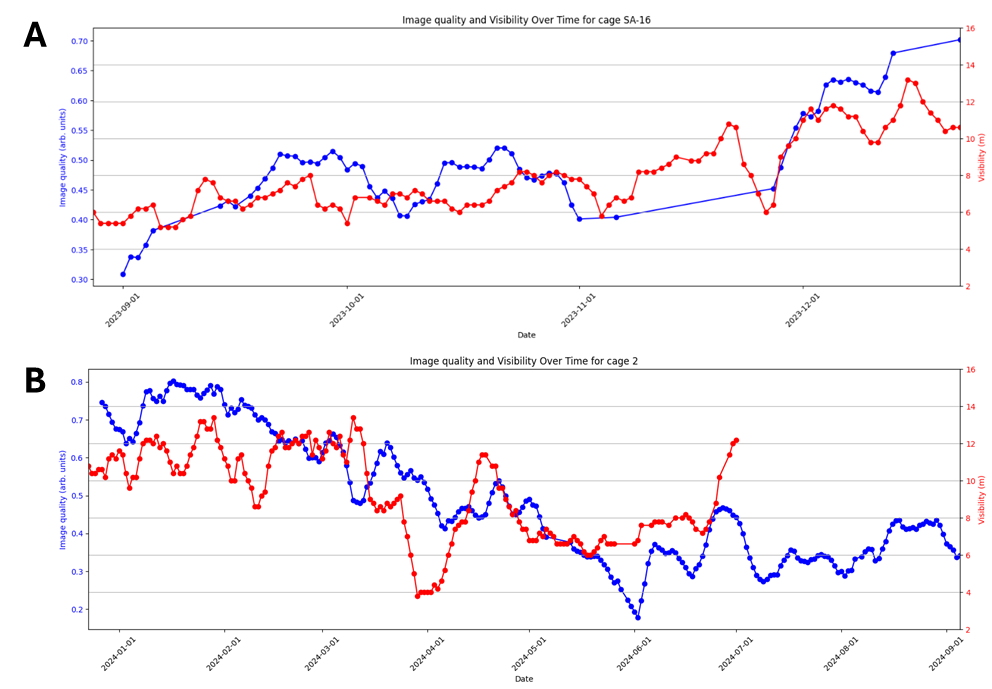
Automated counts from a cage in the small scale trial are shown in Figure 9, together with 4 standardised manual counts of 100 fish. The water visibility in the small scale trial is worse than is typically seen in commercial pens, as the small scale pens are located close to shore and have shallow depth. Secchi disk measurements of water visibility at the small scale location are shown in Figure 10A, along with a measure of image quality (in arbitrary units), where 1 represents ideal quality and 0 represents the worst. The observed image quality shows a clear correlation with Secchi disk visibility measurements over time, but it may also be influenced by factors such as window cleanliness, ambient light conditions, camera movement or weather. This correlation suggests that image quality could serve as an automated gauge for water conditions in locations where Secchi disk measurements are unavailable. Water visibility has a significant impact on image quality. One of the major risk factors in camera-based lice counting is the inability to detect all lice in poor conditions. Therefore, it is crucial to quantify the conditions under which such a system has been validated.
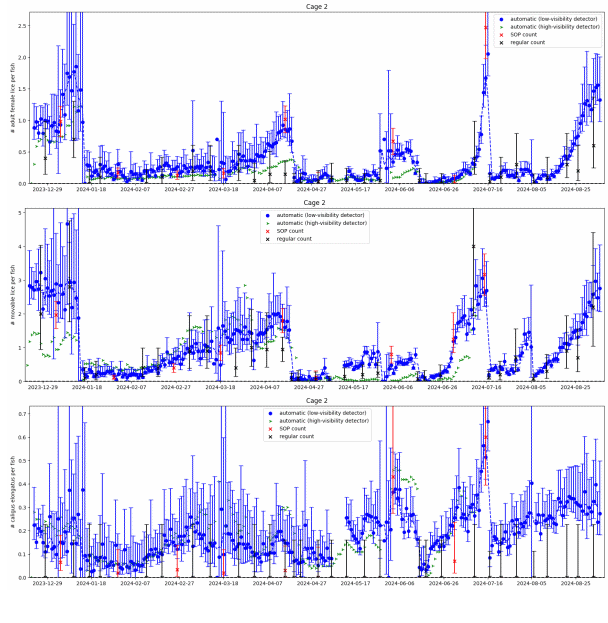
In Figure 9 we see large differences between the low-visibility and the high visibility detector algorithm. Particularly in the beginning of the small scale trial when visibility were below 6 meters the high-visibility algorithm would only detect about 1 out of 5 mobile lice. The low visibility algorithm matches the standardised counts for salmon lice well over the trial period. Figure 11 shows daily automated counts from one of the cages in the large scale trial, compared with both standardised and regular (farmer) manual counts, over the whole trial period from December 2023 to September 2024. Average image quality from the same cage are shown in Figure 10B, together with Secchi disk measurements of visibility performed at the small scale trial site, located approximately 5 km away. As expected, the image quality is high in wintertime when visibility is good (>12 m), with a gradual decline from springtime to summer, then fluctuating low quality before an improvement by the end of August. The correlation between image quality and visibility is not as clear as in the small scale trial, as the Secchi disk measurements are not from the same location, although a long-term pattern is still visible. Here we see that the high-visibility algorithm matches well with standardised manual counts in periods with high visibility but detects too few lice in periods with low visibility. The low-visibility detector algorithm matches well with the standardised counts over the full trial. This example underlines the importance of validating an automated counting system over a range of realistic field conditions. A counting system validated only in a tank study, or in only in pens in periods with high water visibility, might not work at all in pens when water visibility is low, as is usual in spring and summer algae blooms.
Results from the two algorithms tested revealed that the high-visibility algorithm underestimated louse levels compared to manuals counts during the spring, when algae obstructed visibility, while the low-visibility algorithm reflected the manual count. This is particularly problematic as spring is the most critical season for louse count accuracy, as legislation demands reduction from 0.5 to 0.2 adult females per fish from week 16 to the end of week 21.
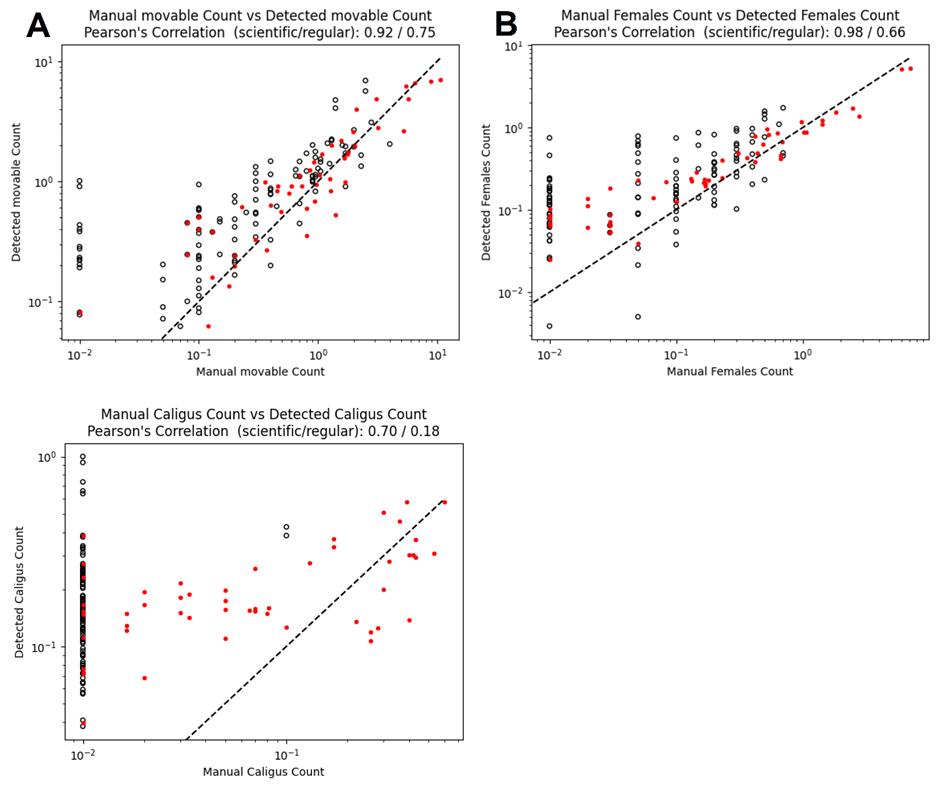
Comparisons of automated counts with the low-visibility detector and manual counts from all the pens in both trials are shown in Figure 12, as a log-log scatterplot. Points that correspond perfectly will fall on the dashed line y=x. A linear regression analysis has been performed to measure the Pearsons linear correlation coefficient, which is presented in Table 1 together with the estimated slope and intercept. It is immediately clear the automated counts correlate much better with the standardised counts than with the regular farmer counts, with a correlation coefficient of 0.981 compared to 0.686 for adult female lice, respectively. The values of the slopes indicate that the automated counts find fewer lice than the standardised manual counts, and more lice than the regular counts. Looking more closely on the comparison of automated counts of adult female lice, we see that on average, they are above the standardised counts for levels < 1 louse per fish, and below the standardised counts for levels > 1 louse per fish. As lice will detach from the fish during capture, it is expected that more lice can be observed on images of free-swimming fish than from a manual count of captured fish. For very high levels of lice per fish, there may be occurrences of clustering of lice (Figure 13). Detecting all louse individuals in a cluster may be challenging, potentially leading to underestimation of louse counts in case of extreme infection levels. Overall, the mean louse level estimation for mobile and adult female lice from the automated lice count system corresponded well with the manual counts, in both small and large scale, over different lice levels and seasons.
| Louse stage | Manual count type | Slope | Intercept | Pearson correlation (r) | R 2 |
| Adult female | Standardised | 0.737 | 0.132 | 0.981 | 0.963 |
| Mobile | Standardised | 0.755 | 0.399 | 0.924 | 0.853 |
| Caligus | Standardised | 0.530 | 0.125 | 0.696 | 0.484 |
| Adult female | Farmer | 1.377 | 0.123 | 0.686 | 0.471 |
| Mobile | Farmer | 1.116 | 0.304 | 0.756 | 0.572 |
| Caligus | Farmer | 2.345 | 0.170 | 0.180 | 0.033 |

3.4 - Other considerations for measurement uncertainty
Bias in estimating infection levels from manual counts can occur through the method choice in collection of fish or assessment technique. Although louse counting occurs on every active farm in Norway, current practices are quite varied between and within companies (Thorvaldsen et al. 2019), demonstrating poor method reproducibility of counts across sites. Many examples have been documented previously, through surveyed industry personnel communicating their experiences in sampling procedure (FHF project 901411; Solberg et al. 2018). However, manual counting protocols do not seem to have evolved since 2018.
We have identified a non-exhaustive list of sources of bias that affect the accuracy of louse levels at commercial sites (Table 2), and address some of these factors using other data sources below.
| Environmental / external | Weather conditions |
| Time of day | |
| Use of other cage adaptions (e.g. submergence/snorkels, skirts, cleaner fish hides) | |
| Collection of fish | Crowding method (e.g. feed-attraction, crowding net type) and duration |
| Anaesthetic compound used | |
| Number of fish in sedation vessel, mesh size and material of dip net | |
| Representativeness of fish caught (behaviour, health status) | |
| Sample size | |
| Assessment method | Counter experience and training (and personal conditions, e.g. working hours) |
| Collection of lice from the sedation vessel | |
| Use of artificial lighting, magnifying glass, water bath, and light conditions |
3.4.1 - Fish collection method
The most common methods to collect fish include three major types of equipment: a crowding net, a lift net on a crane (glip in Norwegian), and a smaller crowding net permanently installed onto the net wall (Thorvaldsen et al. 2019). Recently, a ‘jump net’ has been demonstrated as a viable method for sampling, where fish passively jump into a shallower holding area at the surface – however, captured fish were three times more parasitised, so this method is not advisable for manual counts (Loebmann et al. 2024). There is a lack of published, quantitative data on how crowding and netting directly affects detachment of lice. This is unsurprising given how logistically difficult such a study would be, however some research- and commercial-scale descriptions have indicated that sampling time and crowding period has little to moderate effect on louse counts (Berntsen et al. 2018, Nersten 2021). Surprisingly, one study at a commercial site found slightly more adult female and mobile lice during crowding compared to pre-crowding; although not significant, the difference suggests that taking fish once they are pumped into the well-boat is more representative compared to netting them from the surface (even in a crowd net; Nersten 2021). Preliminary data from the FHF project ‘LusoppsamlingSjø’ (Geitung et al., in prep.) indicates between 2 and 38% of lice detach during crowding with a standard coarse seine net (orkastnot in Norwegian). Averaged over four crowding trials (60-120 min each), 20% of C. elongatus , 20% of pre-adult 1, 13% of pre-adult 2, 9% of adult males, and 8% of adult female L. salmonis detached.
Nertsen (2021) found no difference in the use of swipe/sweep net crowding compared to float line crowding. A preliminary study has compared two crowd net materials (a ‘standard’ and a ‘catchLICE’ net; supplied by OK Marine, Norway) on the rate of detachment, and found that while the difference was negligible in most cases, there was one trial in which nearly 3 times more adult female lice detached with the standard crowding net than with the catchLICE net (Geitung et al. in prep). The source of variation may not be related to the net fabric, rather the execution of the crowding or netting procedure or other uncontrolled variables.
There is some debate regarding whether emaciated fish should be included in a sample for manual counts. We considered the representativeness of this type of fish for the cage as a whole. Emaciated fish can harbour a higher infection level than a healthy fish, and some arguments exist that they should be included in a sample as they reflect the prevalence of such fish in the cage (Solberg et al. 2018). There can be examples where a significant proportion of the school has a lower condition factor yet survives and continues to grow through to slaughter, and thus they do represent a meaningful component of the cage demographic. Arguments against including them note that severely emaciated individuals (so-called ‘loser’ fish) may be disproportionately captured by some sampling methods and therefore be overrepresented in the sample. For the SOP, if a substantial proportion of fish are indeed emaciated, we refer to the advice of a fish health expert that can assess the representativeness of this group for the cage as to whether they should be included in the manual count sample.
3.4.2 - Louse detachment and anaesthesia
Our small and large scale experiments generated predictions of the probability of the different louse stages falling off into the anaesthetic bath, where pre-adult 1 and pre-adult 2 males were the most likely to be found in the sedation vessel, and adult females had a moderate likelihood of detachment. Sessile louse stages are rarely found, and here they were somewhat more prevalent as our counters are extremely experienced and are more likely to see them in the filtered water or vessel walls. Although the absolute values of proportion of counted lice that are found in the vessel can vary greatly, the pattern among louse stages is relatively consistent with our extensive experience in research settings and commercial sites, and other unpublished data sources. Other studies have found that the adult male stage is the most likely to detach, with a similar rate to adult females (Nersten 2021). Some also find that the majority of counted lice were found in the sedation bath rather than on the host.
The reason for differences among reported trends in detachment could be largely attributed to a) the crowding and netting method, b) the number of fish simultaneously in the dip net or vessel, and the violence of their behaviour (i.e. severe thrashing could dislodge lice faster), c) the strength of sedative applied and duration of exposure (of host and parasite) to the anaesthetic compound, or d) the ‘strength’ of the lice (e.g. if they have recently been exposed to stressors). Optimising the netting and sedation procedure could reduce some of these effects.
Through the extensive experience of the research groups at Havforskningsinstituttet and University of Bergen, no differences in detachment probability with sedative compound has been identified. Benzoak (benzokain) and Finquel (trikainmesilat) are the most common sedatives used on commercial sites and the rate of detachment is largely variable for both, again indicating that the other aspects of handling are the likely influencers of detachment rate. Metomidate hydrochloride (Aquacalm) has been used in experimental settings and has been found to reduce detachment of mobile lice, however to our knowledge, this product is no longer available for use in Norway.
3.4.3 - Standardised count method
A few studies have investigated the potential influence of environmental conditions and human experience on counter performance (see Thorvaldsen et al. 2019), and it appears that a consistent theme is the necessity for a certain level of training and experience. It is common practice to used ‘certified’ or ‘educated’ personnel when conducting more formal louse counts at commercial sites, with many engaging in a third party health service to provide robust data. Validation efforts should adopt this approach. Bernsten et al. (2018) highlighted the requirements for a unified training procedure for louse identification, and in the SOP we describe (as an example) the gold standard of certification provided by HI.
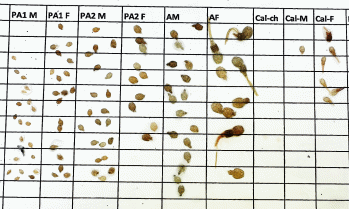
It is somewhat expected that large variation in louse counts will inherently exist among counters (e.g. Thorvaldsen et al. 2019), yet the true abundance of lice on a fish is a finite, defined number, and so variations between counters must reflect suboptimal counting practices. To counter this, we recommend removing mobile lice onto white paper to identify them. By doing so, double-counting is avoided, and identification of stage and sex is easier as the size difference between stages can be distinguished and the genital segment can be contrasted to the white background (see Fig. 14). This is also more advantageous in that people who measure the lice to determine stage will avoid misidentification through temperature-driven differences in body size (i.e. lice developed at warmer temperatures will have larger bodies than those from colder temperatures).
Even with trained and experienced personnel, the laborious nature of manual counts means that including all louse stages in a standardised count will be time-consuming. Even though data on the full population demographic is valuable from a scientific perspective, validation of automated counts only requires the comparison of reportable stages (sessile, mobile, adult females). Thus, in the interest of realistic and robust data collection, we recommend the more broad categorisation of stages with the addition of pre-adult 2 females (so that development trajectories can be identified and understood) and Caligus elongatus adults.
3.4.4 - Representativeness of sampled fish
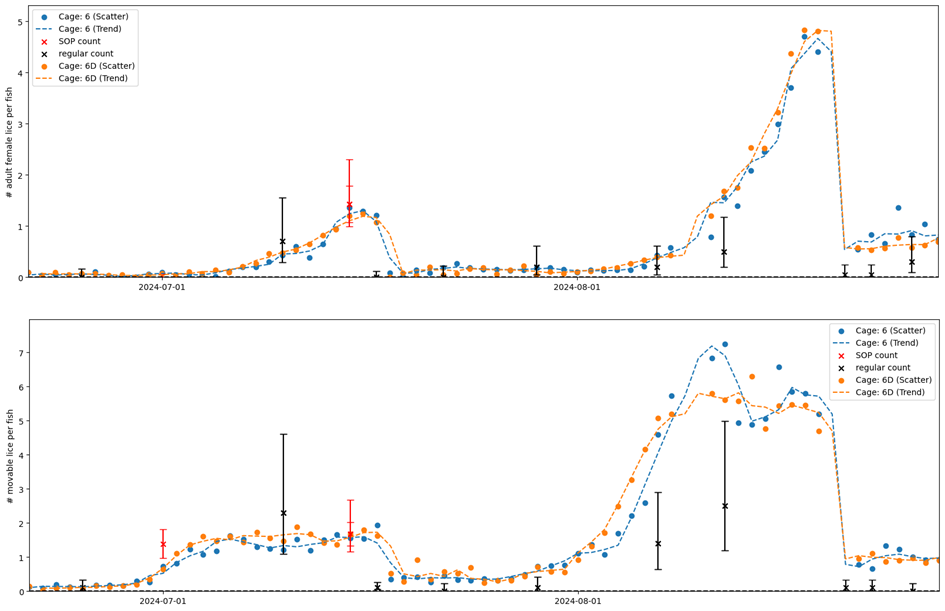
Salmon behaviour is largely driven by environmental stimuli, social interactions, and individual needs such as hunger or health status. The method of capturing fish may bias the representativeness of a sample – for example, if fish are only collected using a dip net then only individuals swimming near the surface (either because they are very hungry or in poor health/condition) will be included in the sample group. Similarly, the deployment of the camera could also bias the range of images collected if the camera position is static and away from the main school. In the present study, placing the camera at 6 m vs. 8-11 m did not appear to have a consistent effect on long-term louse density trends, although some daily estimates did differ (Fig. 15). However, both positions were close to the depth of the main school. Cameras placed well away from the main school may sample unrepresentative individuals, or have such a low image frequency that precision suffers. In general, the camera should be placed in the main school, where there is high fish density, to ensure a large sample size of high quality images of representative fish. The camera position should be regularly checked against the school depth using echo sounders and/or a video camera.
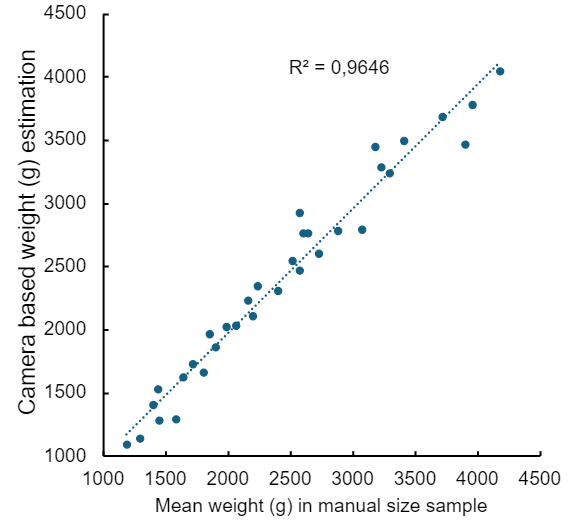
If camera systems are capable of estimating fish size, the representativeness of the sample group can be verified by comparing the size distributions estimated by the automated system with the weights of fish sampled manually. In the present study, there was good agreement (R² = 0.96) between mean fish weights from manual samples and mean estimated weights from the automated system (Fig. 16), providing one line of evidence that the manual and automated methods are sampling representatively (at least with respect to each other, and presumably also with respect to the whole cage population). Comparisons between harvest data and the most recent automated estimates can provide stronger evidence that the entire cage is sampled representatively – technology providers such as OptoScale do this routinely.
4 - Discussion
Why are standardised counts higher, and can they be applied by the industry?
The present finding of a higher louse estimate across all life-stages with standardised counts than farmer counts is not surprising and may be ascribed to several factors, including the counting medium (in water vs. in air), light, time spent counting, and thoroughness of checks for detached lice. Notably, trained personnel follow a standardised protocol, including lifting of fish fins during inspection for full coverage of the fish’s surface, and this will ensure a minimum level of competency in louse detection. While it does require trained personnel, standardised counts have few other requirements in terms of effort and equipment, and none that should be a barrier to its adoption and application within the industry. Equipment including tweezers, buckets, sieve, head torch and paper towel are easily acquired, and involve very little preparation for use. Measurement of fish length and weight is a recommendation but not a mandatory part of the procedure. Weighing fish precicely onboard boats will often require a marine scale with motion/wave compensation, which are expensive and not common equipment at fish farms. While time spent on individual fish size measurement is around 10 s, the time spent counting lice per fish is approximately the double using standardised vs. regular farmer count method (~60 vs. ~30 s), which is not substantial compared to the total time involved in a louse counting operation. However, larger sample sizes will increase time spent and effort in fish capture and handling, especially compared to normal counts during the season when farmers are only obliged to count 10 fish.
What is a sufficient and achievable sample size?
The present data show no evidence of a systematic shift in estimated cage means with increasing sample size from the obligated 20 fish to 30, 60 or 100 fish, meaning that the first 20 fish are not markedly different from those that follow. We cannot entirely rule out the possibility of earlier sampled fish initially having more or less lice than later fish, with differing loss rates of lice in the anaesthetic tub as sampling progresses. However, fish were cycled through the tub at a relatively consistent rate (just long enough to reach adequate sedation/anaesthesia), with oxygenation and anaesthetic concentrations maintained throughout. The most parsimonious explanation is therefore that the first 20 fish were indeed representative of the entire sample, likely because they were captured using the same method at the same time of day (and generally within the same net).
While a sample of 20 fish may be representative in many cases (within the limitations of the particular capture method used), the precision and therefore confidence in the estimate does improve with larger sample sizes (see Figs. 2 and 4; Fig. 17). This is especially important when there is a low infestation density and/or low prevalence of certain louse stages, as a sample of 20 fish in such conditions may include very few lice and lead to a wayward estimate. Pragmatically, 30 fish is therefore recommended as a sample size which is robust (Fig. 17) yet feasible in terms of manual counting effort and time.
The fish sample size in aquaculture for achieving an accurate estimate of distribution and mean for fish size, parasite load or other attributes such as welfare indicators, have been debated for decades. Size estimation has previously received most focus, and while the cumulative mean stabilizes after measuring a relatively small fraction of the group, there is considerable variation depending on where and how fish are captured (Nilsson and Folkedal, 2019). In other words, the mean louse level attained after 20-30 fish as showed in the present study should not change much by counting more fish, while variation of fish capture method and/or spatial position within the cage volume may have a significant effect. This phenomenon is not accounted for in this study. We do regard consistency in fish capture method as important for obtaining similar, and yet unknown, level of representativeness to account for trends in lice levels. The validity of trends can be assessed based on expected louse development rate given the recorded temperature (Hamre et al., 2019).
What is a sufficient and achievable correlation between automated and standardised counts?
Because lice are not uniformly distributed among all the fish in a cage, two samples from the same cage will rarely lead to an identical cage mean estimate, regardless of the counting method (manual or automated). However, Pearson correlation coefficients of r > 0.80 should be achievable given high quality manual counts and an automated system that is working as intended.
For reference, the standardised manual counts conducted within the present study yielded correlation coefficients of r = 0.82–0.99 between two subsamples of 30 fish captured from the same cage at the same time (usually dip-netted out of the same cast/seine net). The lowest correlation (r = 0.82) occurred for adult female salmon lice during the large scale trial (Fig. 18), where densities of adult female lice were relatively low, which will tend to increase the relative error of a sample (as illustrated in Fig. 17). Where louse levels were higher, correlation coefficients of r = 0.94–0.99 were achieved between subsamples of 30 fish assessed using the standardised manual method (Fig. 18). The automated counts achieved a similar level of agreement with standardised manual counts: r = 0.92 for mobile lice and r = 0.96 for adult female lice (Fig. 12). At sites where louse levels are generally low or highly clustered, a greater sampling effort (more samples and/or more than 30 fish per sample) may be required to achieve sufficient precision to reach a correlation of r > 0.80 between standardised and automated estimates.

Study limitations
This study took place at one small scale and one large scale farm, both in the Austevoll municipality, and therefore covered a limited range of conditions. However, the primary aim was to demonstrate the validation of automated louse counts using manual counts as a benchmark, and this was achieved in both cases. The robustness and generalisability of the data was improved through repeated manual sampling over several weeks (small scale) or months (large scale), which captured substantial variation in infestation densities, turbidity, fish size, and other factors that could affect detection rates and levels of agreement between manual and automatic counts. The data here are not representative of other sites in Norway, but are representative of a sampling effort that could be applied to validate automated louse counts at other sites and in other regions.
One important factor that was not directly addressed here is sampling (capture) methods. We used the same capture method throughout to maximise repeatability and comparability between cages and through time, but other research has shown that different capture methods, as well as the timing of sampling, can have a substantial effect on the representativeness of the sample, for example by selectively capturing fish inside or outside the main school (Vindas et al., 2016; Loebmann et al., 2024). The SOP makes considerations for capture methods that are based on evidence gathered outside of this study.
Finally, we were not able to robustly validate automated counts of C. elongatus , because (1) densities of this species were generally low, leading to imprecise estimates derived from manual counts, and (2) reliable classification of C. elongatus (i.e., avoiding misclassification as mobile L. salmonis or vice versa) remains a challenge for the camera based counting system. This was exacerbated by the low densities of C. elongatus in this study, which limited opportunities for model training; further training and validation will continue in areas with higher C. elongatus densities.
5 - Concluding statement
The collection of information from this project and elsewhere has contributed to the development of a preliminary reference standard/standard operating procedure. The use of a standardised count method is essential for any validation efforts, and here we provide recommendations for this procedure. We also highlight points for consideration when validating automated counting systems, and expect that the document can be refined by other experts in the field to facilitate more widespread industry adoption. A reference standard based on manual counts as a benchmark will: a) promote healthy competition among suppliers without the need to directly compare competing products, b) support the use of automated counting systems by laying out a clear path to approval at the site level, c) ensure a level playing field for farmers when it comes time to register louse levels, whether levels are based on manual counts or an automated system, and d) facilitate the advancement of precision livestock farming and continuous monitoring of louse abundances, which in turn will assist farmers to anticipate and respond quickly to outbreaks.
The preliminary SOP is presented in Norwegian and English in a seperate document (Standard operasjonsprosedyre for manuell lusetelling til validering av automatisk telling, English version included: A Standard Operating Procedure for validation of automatic louse counts).
To highlight the main findings:
-
A standardised protocol for louse counts on salmon provides higher n lice than regular manual counts, and match better with automated counts.
-
Counting lice on 30 fish per cage is considered statistically valid in estimating louse level while balancing the demand in labour effort.
-
Seasonal variability in underwater visibility must be included when validating automated counts.
-
A high correlation coefficient between standardised count and automated was found and may be used as a simple proxy for evaluation.
-
The suggested standard operating procedure (SOP) for verification of automated lice count systems is readily available and accessible.
6 - References
Anon (2012) Forskrift om bekjempelse av lakselus i akvakulturanlegg (Regulations on the control of salmon lice in aquaculture facilities). In Lovedata, Ministry of Justice and the Faculty of Law in Oslo. https://lovdata.no/dokument/SF/forskrift/2012-12-05-1140
Barrett LT, Oppedal F, Robinson N, Dempster T (2020) Prevention not cure: a review of methods to avoid sea lice infestations in salmon aquaculture. Rev Aquacult 12: 2527-2543. doi.org/10.1111/raq.12456
Berntsen HH, Sivertsgård R, Uglem I, Pettersen O, Frank K, Solberg I, Finstad B (2018) Testing av metodikk for å registrere forekomst av lakselus i oppdrettsanlegg. (Testing of methods for registering the prevalence of salmon lice in fish farms). NINA report 1544. Norwegian Institute for Nature Research, Trondheim
Brooks M, Kristensen K, Benthem K van, Magnusson A, Berg C, Nielsen A, Skaug H, Mächler M, Bolker B (2017) GlmmTMB balances speed and flexibility among packages for zero-inflated generalized linear mixed modeling. R J 9:378–400.
Bui S, Oppedal F, Stien LH, Dempster T (2016) Sea lice infestation level alters salmon swimming depth in sea-cages. Aquac Environ Interact doi.org/10.3354/aei00188
Dempster T, Overton K, Bui S, Stien LH, Oppedal F, Karlsen Ø, Coates A, Phillips BL, Barrett LT (2021) Farmed salmonids drive the abundance, ecology and evolution of parasitic salmon lice in Norway. Aquac Environ Interact 13:237–248.
Fox J, Weisberg S (2019) An {R} Companion to Applied Regression, 3rd ed. Sage, Thousand Oaks, California.
Hamre LA, Bui S, Oppedal F, Skern-Mauritzen R, Dalvin S (2019) Development of the salmon louse Lepeophtheirus salmonis parasitic stages in temperatures ranging from 3 to 24°C. Aquac Environ Interact 11:429-443.
Hartig F (2019) DHARMa: Residual diagnostics for hierarchical (multi-level/mixed) regression models. R package version 0.2.2.
Heuch PA, Gettinby G, Revie CW (2011) Counting sea lice on Atlantic salmon farms - empirical and theoretical observations. Aquaculture 320:149–153.
Jeong J, Stormoen M, Thakur KK, Revie CW (2021) Imperfect Estimation of Lepeophtheirus salmonis Abundance and Its Impact on Salmon Lice Treatment on Atlantic Salmon Farms. Front Mar Sci doi.org/10.3389/fmars.2021.763206
Jeong J, Revie CW (2020) Appropriate sampling strategies to estimate sea lice prevalence on salmon farms with low infestation levels. Aquaculture 518:734858.
Kristoffersen AB, Qviller L, Helgesen KO, Vollset KW, Viljugrein H, Jansen PA (2018) Quantitative risk assessment of salmon louse-induced mortality of seaward-migrating post-smolt Atlantic salmon. Epidemics 23:19–33.
Loebmann A, Barrett LT, Oppedal F, Dempster T (2024) A passive fish sampling method is representative for size but selective for parasite load. Aquaculture 593:741295
Lüdecke D (2018) Ggeffects: Tidy data frames of marginal effects from regression models. Journal of Open Source Software 3:772.
Mattilsynet 2023: https://www.mattilsynet.no/fisk-og-akvakultur/fiskesykdommer/lakselus/veileder-for-soknader-om-nye-metoder-for-telling-og-rapportering-av-lakselus
Nersten M (2021) Fate of Lepeophtheirus salmonis and Caligus elongatus During Farmed Salmon Crowding. Master’s thesis, NTNU (https://hdl.handle.net/11250/2782504)
Nilsson J, Folkedal O (2019) Sampling of Atlantic salmon Salmo salar from tanks and sea cages is size-biased. Aquaculture 502:272-279.
Overton K, Dempster T, Oppedal F, Kristiansen TS, Gismervik K, Stien LH (2019) Salmon lice treatments and salmon mortality in Norwegian aquaculture: a review. Rev Aquac 11:1398–1417. https://doi. org/ 10. 1111/ raq. 12299
Pedersen EJ, Miller DL, Simpson GL, Ross N (2019) Hierarchical generalized additive models in ecology: an introduction with mgcv. PeerJ 7:e6876.
Revie CW, Gettinby G, Treasurer JW, Wallace C (2005) Evaluating the effect of clustering when monitoring the abundance of sea lice populations on farmed Atlantic salmon. J Fish Biol 66:773–783.
Solberg I, Finstad B, Berntsen HH, Diserud OH, Frank K, Helgesen KO, Jeong J, Kristoffersen AB, Nytrø AV, Revie CW, Sivertsgård R, Solvang T, Sunde LM, Thorvaldsen T, Uglem I, Mo TA (2018) Kartlegging og testing av metodikk for telling av lakselus og beregning av luseforekomst. NINA.
Thorstad EB, Todd CD, Uglem I, Bjørn PA, Gargan PG, Vollset KW, Halttunen E, Kålås S, Berg M, Finstad B (2015) Effects of salmon lice Lepeophtheirus salmonis on wild sea trout Salmo trutta - a literature review. Aquaculture Environment Interactions 7:91–113.
Thorvaldsen T, Frank K, Sunde LM (2019) Practices to obtain louse counts at Norwegian salmon farms: status and possible implications for representativity. Aquaculture Environment Interactions.
Vindas M, Johansen IB, Folkedal O, Höglund E, Gorissen M, Flik G, Kristiansen TS; Øverli Ø (2016) Brain serotonergic activation in growth-stunted farmed salmon: adaption versus pathology. R. Soc. Open Sci. 3:160030
Vollset KW, Dohoo I, Karlsen Ø, Halttunen E, Kvamme BO, Finstad B, Wennevik V, Diserud OH, Bateman A, Friedland KD, Mahlum S, Jørgensen C, Qviller L, Krkošek M, Åtland Å, Barlaup BT (2017) Disentangling the role of sea lice on the marine survival of Atlantic salmon. ICES J Mar Sci 75:50–60.
Wickham H (2016) ggplot2: Elegant Graphics for Data Analysis. Springer-Verlag New York.
Wood S, Scheipl F (2017) gamm4: Generalized Additive Mixed Models using “mgcv” and “lme4.”
7 - Appendices
Table A1. Analysis of variance tables corresponding to Models 1-2 (small scale trial).
| Model 1 | |||
| Response: Cage mean density (lice/fish) | |||
| Term | X2 | df | p |
| Class | 510 | 3 | <0.0001 |
| Medium | 22 | 1 | <0.0001 |
| Sample | 596 | 1 | <0.0001 |
| Class x Medium | 29 | 3 | <0.0001 |
| Class x Sample | 140 | 3 | <0.0001 |
| Model 2 | |||
| Response: Cage mean density (lice/fish) | |||
| Term | X2 | df | p |
| Class | 189 | 4 | <0.0001 |
| Sample size | 0.12 | 1 | 0.73 |
| Class x Sample size | 0.14 | 4 | 0.99 |
Table A2. Approximate significance of smooth terms from 12 generalised additive models (Model 3, large scale trial). ‘edf’ = estimated degrees of freedom.
| Model 3 | |||||
| Response: Cage mean density (lice/fish) | |||||
| Class | Cage | Term | F | edf | p |
| Sessile | 1 | s(Day, Method) | 0.45 | 3.2 | 0.11 |
| 2 | s(Day, Method) | 2.2 | 9.5 | 0.0015 | |
| 6 | s(Day, Method) | 0.63 | 3.7 | 0.020 | |
| 7 | s(Day, Method) | 0.58 | 4.2 | 0.046 | |
| Mobile | 1 | s(Day, Method) | 1.4 | 5.3 | 0.011 |
| 2 | s(Day, Method) | 1.7 | 6.8 | 0.0013 | |
| 6 | s(Day, Method) | 3.5 | 10.5 | 0.0001 | |
| 7 | s(Day, Method) | ~0 | ~0 | 0.49 | |
| Adult female | 1 | s(Day, Method) | 0.38 | 2.9 | 0.13 |
| 2 | s(Day, Method) | 1.0 | 3.9 | 0.0018 | |
| 6 | s(Day, Method) | 0.59 | 3.3 | 0.016 | |
| 7 | s(Day, Method) | 0.20 | 1.7 | 0.092 | |
Table A3. Analysis of variance tables corresponding to Models 4-6 (large scale trial). ‘Medium’ refers to in-air or in-water counts performed by HI staff.
| Model 4 | |||
| Response: Cage mean density (lice/fish) | |||
| Term | X2 | df | p |
| Class | 131 | 4 | <0.0001 |
| Medium | 48 | 1 | <0.0001 |
| Class x Medium | 50 | 4 | <0.0001 |
| Model 5 | |||
| Response: Fish-level louse count | |||
| Term | X2 | df | p |
| Class | 76 | 2 | <0.0001 |
| Sample size | 1.0 | 1 | 0.31 |
| Class x Sample size | 0.63 | 2 | 0.73 |
| Model 6 | |||
| Response: Detachment rate of lice in anaesthetic tub | |||
| Term | X2 | df | p |
| Class | 24 | 5 | 0.0002 |
8 - Project deliverables
Folkedal et al. 2024. AutoSOP – Utvikling av referansestandard for automatisk lusetelling. FHF Lusekonferansen 2024. 24.01.2024. Trondheim. Talk and presentation.
Folkedal et al., 2024. Standard operasjonsprosedyre (SOP) for validering av automatisk lusetelling (AutoSOP). NCE Aquatech Cluster fagseminar om automatisk lusetelling. 24.09.2024. Værnes. Talk and presentation.
https://borsen.dagbladet.no/nyheter/apner-for-juks/81387788
https://borsen.dagbladet.no/nyheter/lakselus-store-telle-avvik/81287262