Kunnskapen om mengde, utbredelsen og livshistorie til taskekrabbe (Cancer pagurus) og sjøkreps (Nephrops norvegicus) langs norskekysten er begrenset på grunn av mangel på fiskeri-uavhengige data. Dette sammenfaller med et generelt overvåkingshull i kystnære områder på Vestlandet, hvor det ikke gjennomføres regelmessige fiskeriundersøkelser. Undersøkelsen i oktober 2023 var derfor en pilotstudie med mål om å 1) samle data om de to viktige skalldyrartene i områder hvor kommersiell og fritidsfiske finner sted, 2) teste et undersøkelsesdesign som grunnlag for fremtidig overvåking av disse artene, inkludert video, og 3) validere representativiteten av kommersielle data samlet inn av referansefiskere for begge arter. Totalt ble 41 krabbeteine- (6 teiner i hver lenke), 26 sjøkrepseteine- (12 i hver lenke) og 7 videosledestasjoner gjennomført. Stasjonene ble plassert i et semi-randomisert design i forhåndsvalgte områder basert på bunnsubstrat.
Vi fanget krabber og sjøkreps på alle teinestasjonene. Vi observerte høyere og mer variable fangstrater for sjøkreps under Vestlandstoktet sammenlignet med fangstrater fra tokt i det kommersielt viktige området, Frohavet. For krabbe hadde vi noe mindre, men tilsvarende fangstrater i Vestlandstoktet som i Møre og Trøndelag-undersøkelsen i 2021. Begge teinetypene, taskekrabbe og sjøkreps, var svært artsselektive og det var lite bifangst.
En felles teineundersøkelse for taskekrabbe og sjøkreps var en produktiv bruk av tokttiden, men det er fortsatt mange uløste spørsmål om hvordan fangstene fra teiner reflekterer tetthet og populasjonsdemografien. Dette trenger mer evaluering og helst i kombinasjon med andre redskapstyper som video. Etter noen forsøk, lyktes vi med den nye videometoden for å undersøke om telling av sjøkrepshuler kan være et alternativt verktøy for bestandsovervåking. Det var kun fire videoer av egnet kvalitet, og vi anbefaler derfor videre testing av fangster i teiner og trål parallelt med video. Fangstratene for taskekrabbe var lavere enn i referansefiskeriet, men referansefiskeriet foregår lenger sør og fangstratene er derfor ikke direkte sammenlignbare. Regelmessige overvåkingstokt vil sikre en god oppfølging av bestandene og mer data som vil bidra til mer pålitelige bestandsestimater og analyser. I tillegg vil det være relevant å gjennomføre en lignende undersøkelse i Skagerrak hvor både fritids- og kommersielle fangster er høye for taskekrabbe og moderate for sjøkreps.
Summary
Knowledge about the abundance, distribution and life-history of brown crab (Cancer pagurus) and Norway lobster (Nephrops norvegicus) along the Norwegian coast is limited due to a lack of fisheries-independent data. This coincides with a general monitoring gap of inshore areas in Western Norway (Vestlandet) where no regular fisheries survey takes place. The survey in October 2023 was a pilot study aiming to 1) collect data on the two important shellfish species in an area where commercial and recreational fishing takes place, 2) test a survey design as basis for potential future monitoring of these species on a more routine basis, including with a video sled, and 3) validate the representativeness of commercial data collected by reference fisheries on both species. In total, 74 stations were conducted: 41 with crab pots (6 pots in each link), 26 with Nephrops pots (12 in each link) and 7 with video sled. Stations were placed in a semi-randomized design in pre-selected areas based on bottom substrate, and in case of crab pots partially at or near stations of IMR’s fyke and gill net survey.
We caught crabs and Nephrops at all pot stations, respectively. We observed more variable and higher Nephrops catch rates during the Vestlandet survey compared to catch rates from a survey in the commercially important area, Frohavet. We had similar catch rates in the Vestlandet survey as in the 2021 survey in the commercially important area, Møre and Trøndelag. Both pot types, brown crab and Nephrops, were very species-selective and there was little by-catch.
A joint pot survey for brown crab and Nephrops constituted a productive use of the survey time, but there are still many unresolved questions regarding how catches from pots reflect the population density and demography. This needs more evaluation and preferably in combination with other gear type such as video. After some trial, we succeeded with the new method, video sled, for investigating and counting Nephrops burrows as an alternative tool for stock monitoring. However, only four videos were of suitable quality, and we therefore recommend further testing of catches in pots and trawls in comparison to the video. The catch rates for the brown crab were lower in the Vestlandet survey than in the reference fishery, however, the reference fishery takes place further south, and the two surveys are therefore not directly comparable. Regular monitoring cruises will ensure a good follow-up of the stocks and more data which will in turn contribute to more reliable stock estimates and analyses. In addition, it would be relevant to carry out a similar survey in Skagerrak where both recreational and commercial catches are high for brown crab while moderate for Nephrops.
1 - Background
There are many knowledge gaps concerning the marine ecosystems in the fjords on the Norwegian west coast in general and the status of commercially important shellfish stocks in particular. The pot fishery for Norway lobster (Nephrops norvegicus; hereafter Nephrops) in fjords and along the western coast of Norway is increasing. Concerning the brown crab (Cancer pagurus), current available data, based on a reference fleet of commercial crab fishers, indicates a recent decline following high densities in the stock on the west coast (Marcussen et al., 2022). Furthermore, the European lobster (Homarus gammarus) stock has declined for many years, and the stock is believed to be at a historical low level (Kleiven et al., 2022 and references within). All three fisheries, Nephrops, crab and lobster, are co-exploited by recreational and commercial fishers. Two bottom trawl surveys in 2021 and 2022 indicated that northern shrimp (Pandalus borealis) has almost disappeared from previous commercially important shrimp fields in Western Norway (Zimmermann et al., 2021; Søvik et al. 2023).
Knowledge on the distribution and abundance of several of the coastal shellfish stocks on the Norwegian west coast is limited to fishery-dependent data and have not yet been validated by fishery-independent surveys. The current monitoring of Nephrops, brown crab and European lobster is based on fishery-dependent data. The 2023 survey therefore aimed to increase the knowledge on some of the coastal shellfish species on the west coast of Norway in Western Norway (hereafter Vestlandet) by (i) collecting biological data on brown crab, Nephrops and other shellfish species, (ii) cross-validating data from both the brown crab and Nephrops reference fishers with scientific survey data from the same area, (iii) cross-validating brown crab catch data from a pot survey with catch data from the annual gill-and-fyke-net survey of IMR to evaluate whether the gill and fyke net survey can serve as a reliable time series for monitoring and assessing the brown crab, (iv) testing a video-based approach for surveying relevant Nephrops areas, similar to the method used by other countries for monitoring Nephrops stocks (a possible steppingstone for moving towards automated imaged-based monitoring), and finally by (v) collecting environmental data as explanatory variable(s) for occurrence and distribution of target species, as basis for future species distribution models.
The 2023 survey can be seen as a prolongation of the surveys 2021854 and 2022603 in 2021 and 2022 which mapped coastal ecosystems between Stadt and Hardanger using a bottom trawl, pelagic trawl and sandeel dredge (Zimmermann et al., 2021; Søvik et al., 2023). The main focus of those surveys was mapping demersal fish and shellfish species on shrimp and sandeel-fields. The 2021 and 2022 surveys caught Nephrops in only small quantities, while brown crab and European lobster are found in shallower areas and different habitats, not accessible to bottom trawl. The 2023 survey caught Nephrops with more suitable gear and covered shallow coastal habitats, thus complementing the 2021 and 2022 surveys. Furthermore, the 2023 survey serves to fill in gaps in the brown crab fishery-independent mapping which has so far only been conducted during the 2021006 pot survey in Møre and Trøndelag.
1.1 - Commercial landings
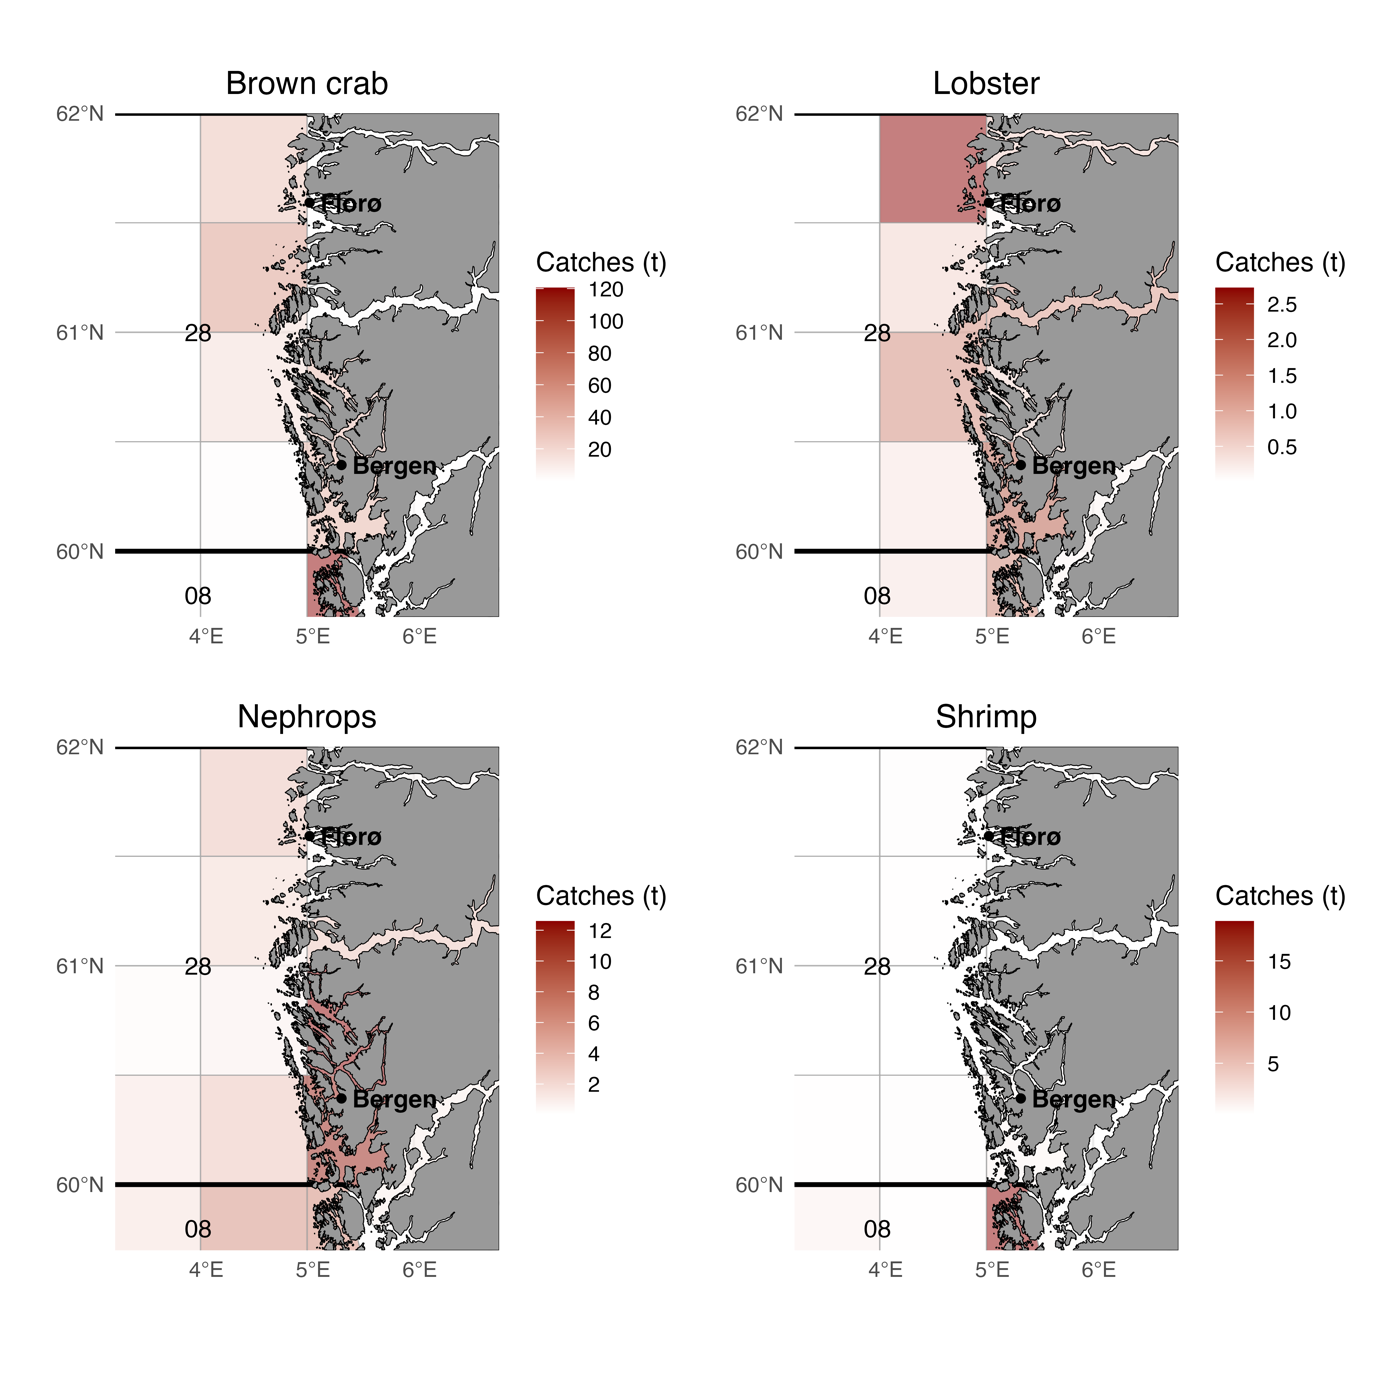
Compared to other regions of Norway, Vestlandet, comprising statistical fishing areas 28 and the northern part of 08, has intermediate to low commercial landings of all of the four shellfish species, European lobster, Nephrops, brown crab, and northern shrimp (Figure 1). The highest landings of brown crab originate from southern areas in Vestlandet, whereas the highest landings of Nephrops and European lobster were registered in the fjords on the inside of Askøy and Sotra, and from northern areas around Florø, respectively. Commercial fishing of northern shrimp has almost ceased entirely between 60˚ and 62˚ north.
During the last 10 years (2013–2023), in average 767 tonnes of brown crab have been landed annually in the area, in comparison the commercial landings in Norway as a whole were on average 5076 tonnes annually in the same period. In statistical areas 08 and 28, combined, the crab landings decreased after 2015, likely due to a reduction in the number of landing facilities.
Norwegian commercial pot landings of Nephrops from Vestlandet has increased since the mid-2000s (ICES, 2023). This contrasts an overall decline of the Nephrops fishery in the ICES functional unit 32 that includes Vestlandet (ICES, 2024). Commercial catches of Nephrops are often dominated by males (ICES, 2023), as females often remain in their burrows (Chapman, 1980; Eiriksson, 2014).
Figure 1 : Commercial landings (tonnes) of brown crab (Cancer pagurus), European lobster (Homarus gammarus), Nephrops and northern shrimp (Pandalus borealis) in the statistical areas 08 and 28. The landings are mean annual landings for each statistical location (grid cells indicated with thinner lines) in the period 2013–2023. Thick black lines indicate the borders of statistical areas. Note different scale of the landings for each species.
2 - Methods
2.1 - Survey area
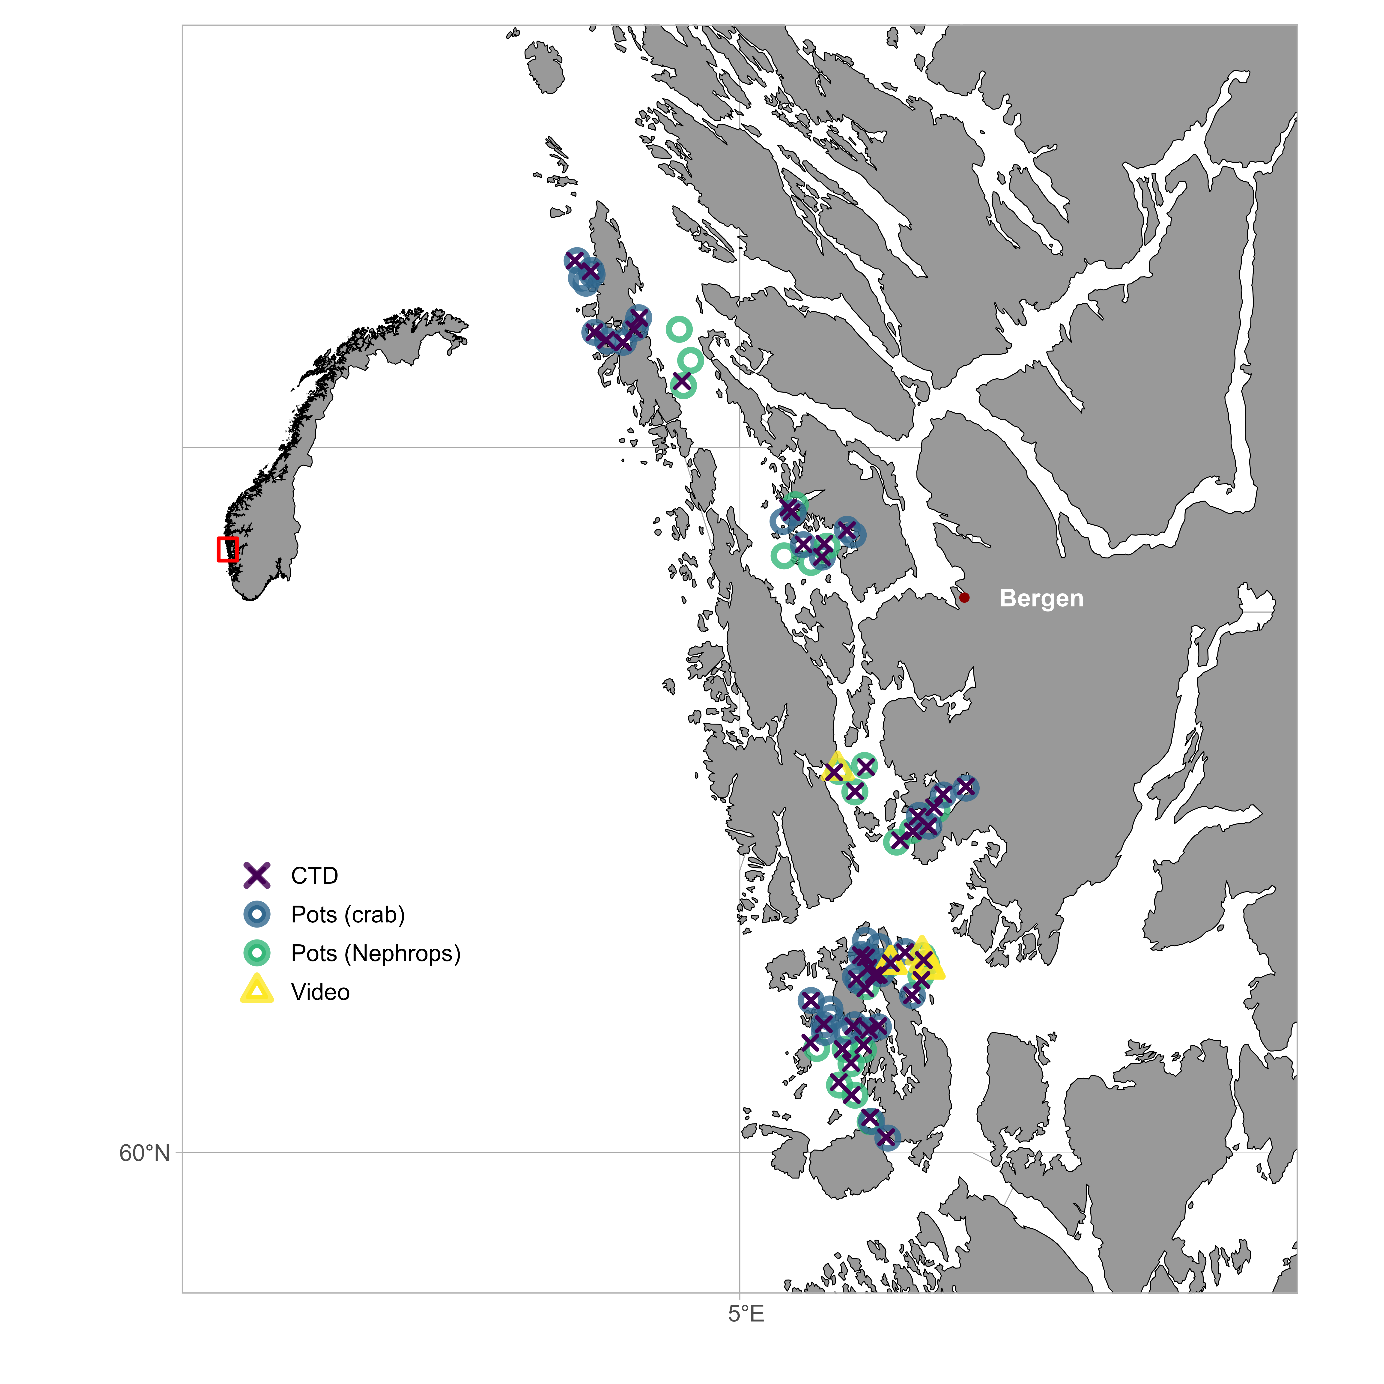
To map the distribution and explore population demographics of selected important shellfish species in inshore areas of Vestlandet, we conducted a pot and video survey in fall 2023. Between the 17th and 29th of October 2023, we sailed with the research vessel Prinsesse Ingrid Alexandra (PIA) in coastal areas around Bergen, from Austevoll in the south to Askøy in the north (Figure 2). Fabian Zimmermann, Olve Haugan (Guri Kunna vgs.), Guldborg Søvik, Erik Schuster and Johanna Bjånes Marcussen (UiA/HI) worked at the deck, both deploying and hauling the pots helped by one person from the PIA-crew, and registered catch data and individual measurements of target species.
Stations were assigned prior to the survey (Figure 2; Appendix 1) but were adjusted upon arrival if gear could not be deployed safely at the selected position. Several sites selected a priori were upon arrival found to be occupied by fixed gears not registered in BarentsWatch and could not be sampled. In some fjords and areas there was limited or no space for our gears, and pot stations were therefore moved, ensuring a safe distance to other fishing gear, aquaculture sites or other installations. However, on several occasions our gear got entangled in other people’s unregistered gears, and on a few occasions the rope to the buoy was cut by passing boats. All pots were, however, retrieved by using a modified anchor and dredging over the area where the pots had been deployed and lost.
Figure 2 Overview of stations used during the survey in Vestlandet in October 2023, where symbols indicate the different station types: pot stations (brown crab or Nephrops), video stations and physical measurements (CTD).
2.2 - Pot survey - brown crab and Nephrops
Brown crab and Nephrops stations were, in general, spatially segregated based on bathymetry and bottom habitat. The crab pots were placed at sites shallower than 50 meters, with exception of a few selected sites to explore the possible occurrence of crabs in deeper waters (>100 meters). The Nephrops pots were placed at depths between 120 and 300 meters on soft bottom in relatively flat areas, mapped as commercial shrimp fields.
For the crabs, black polyethylene pots (L: 80 cm; W: 35 cm; H: 31 cm) with an entrance on each side were used (Figure 3). This is the same type of pots used by the IMR reference fleet as well as in two earlier IMR crab surveys in 2021 and August 2023 (Marcussen et al., 2022; Marcussen et al., 2024). Each pot line consisted of six crab pots with 20–25 meters distance between the pots (Appendix 2), each one baited with 0.5–1 kg saithe (Pollachius virens).
The Nephrops pot lines consisted of 12 pots each (Figure 4; Appendix 2), baited with the heads of either red fish (Sebastes sp.) or cod (Gadus morhua). The pots itself were standard commercial, quadratic lightweight pots made of plastic, with openings on each side. To obtain an effective rotation between the sites, while ensuring sufficient soak time, the crab pots were hauled every 12–48 hours, while the Nephrops pots were sitting in the water for 36–48 hours.
Figure 3: Black crab polyethylene pots (L: 80 cm; W: 35 cm; H: 31 cm) used in the 2023 survey in Vestlandet.
To ensure capture of all crab sizes, escape holes in the pots were blocked, with permission from the Norwegian Directorate of Fisheries. There is currently no requirement for escape holes in Nephrops pots. In line with current regulations, all pots were rigged with a cotton thread in the opening mechanism to prevent ghost fishing and were marked with a name tag.
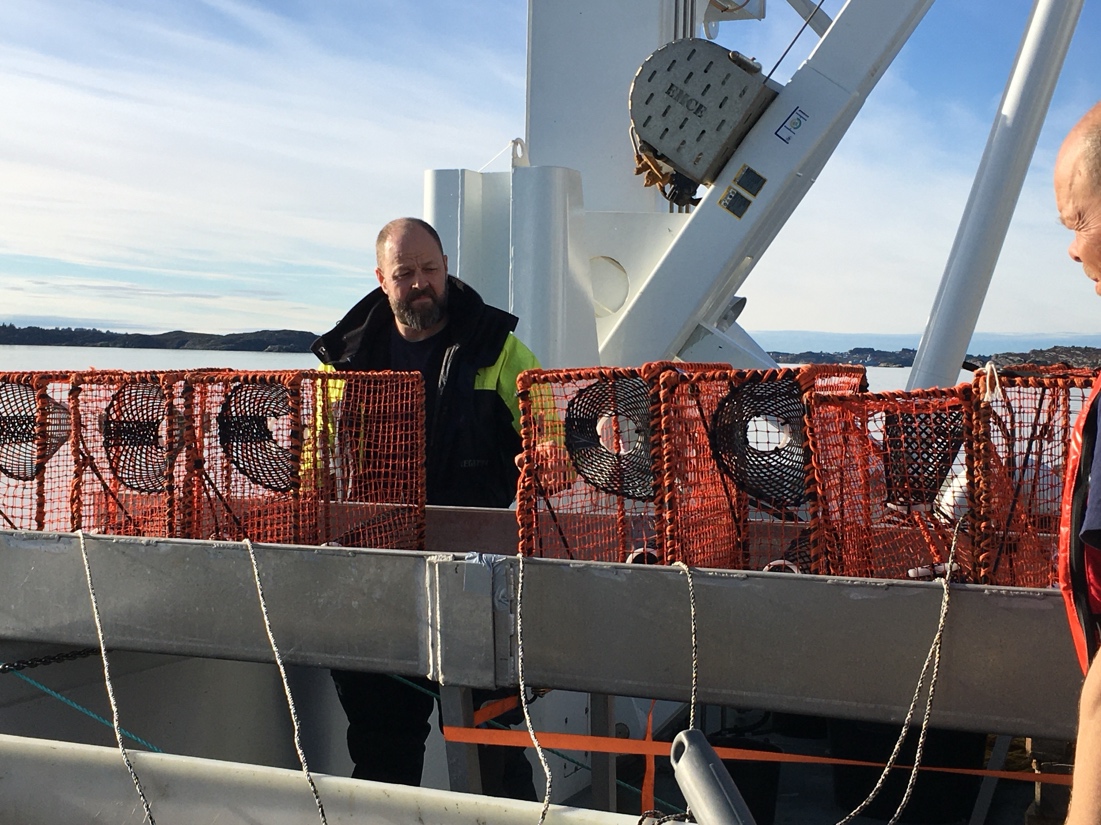
Figure 4: Line of Nephrops pots about to be set out in the sea in the 2023 survey in Vestlandet.
2.3 - Biological measurements
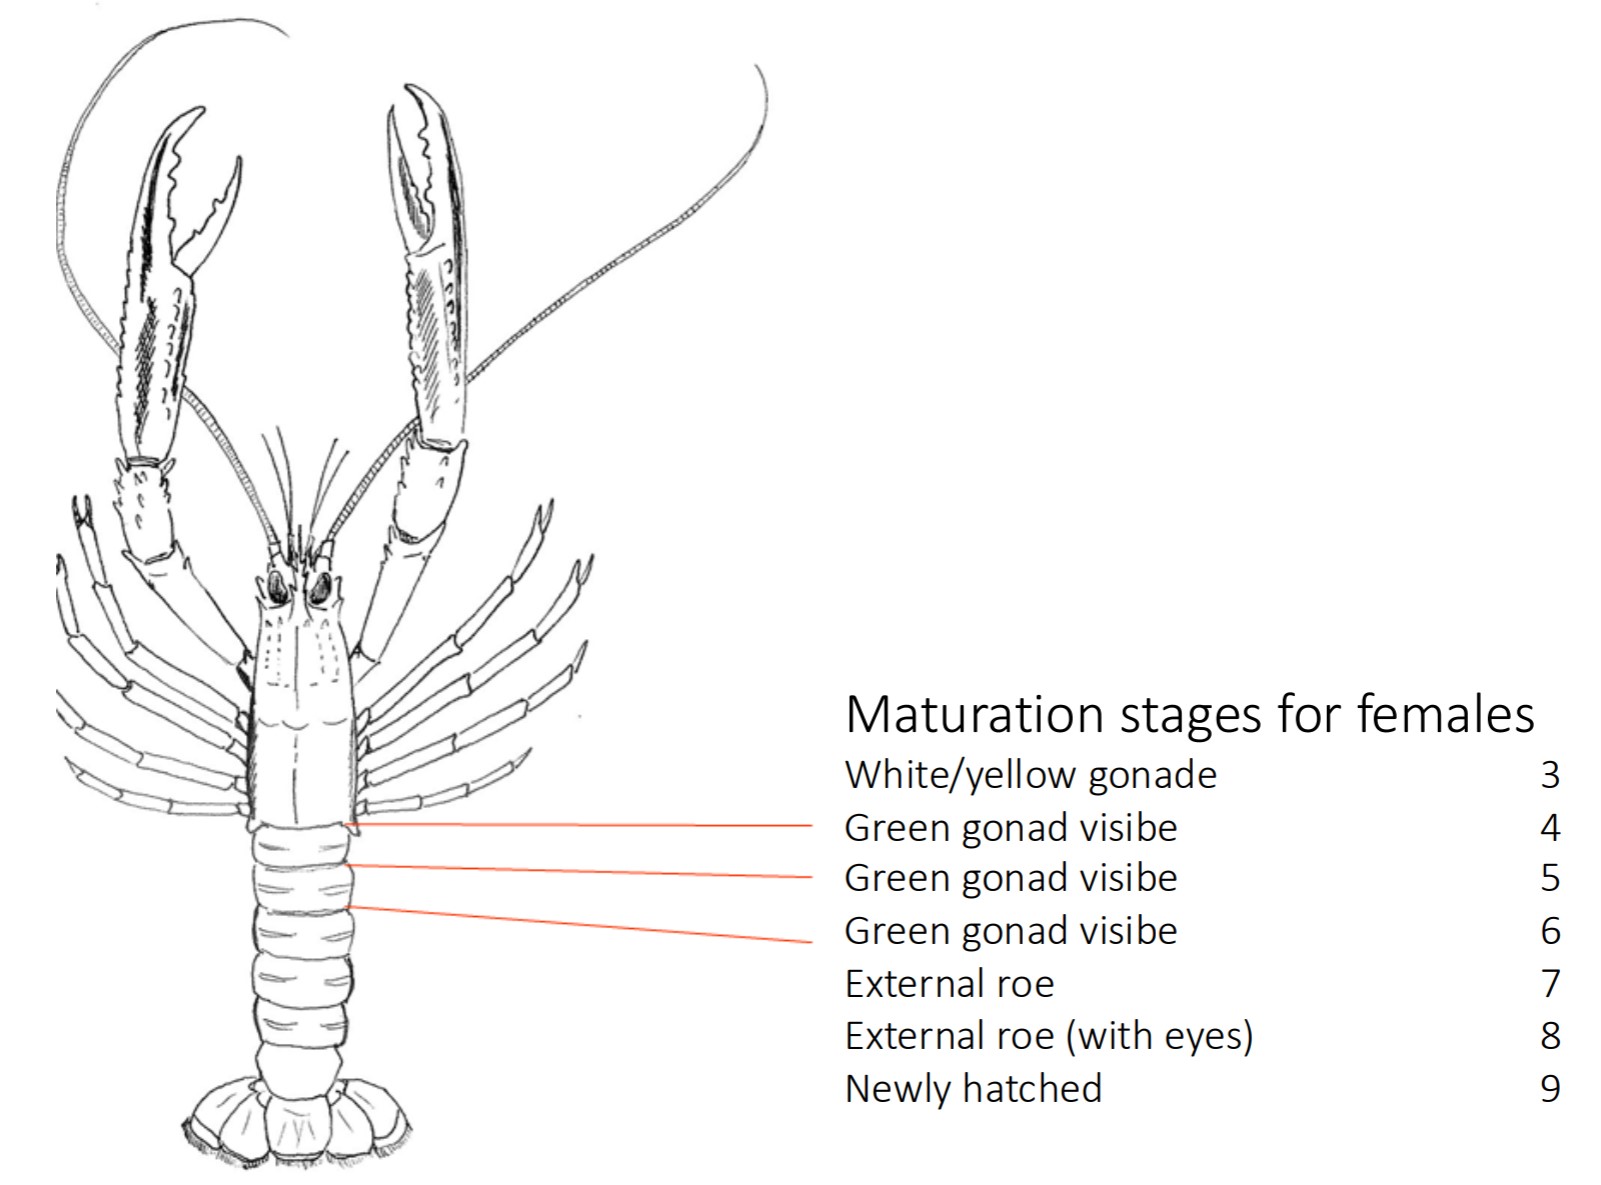
For all crab species, Nephrops and lobster, individual measurements were taken. The measurements included weight and size (carapace width for crabs, and carapace and claw length for Nephrops and lobsters). For crabs, carapace “age” was determined based on the following criteria: (1) clean and soft shell, (2) new, hard shell without growth, pointed toe tips and no black spots, (3) hard shell with some growth, some worn toe tips and dark spots, and (4) hard, dark shell with a lot of growth and rounded toe tips. For the first time, we took systematic note of missing claws (one or both). Maturation stage for female Nephrops was recorded according to Figure 5. Size was measured with a digital caliper and all data were recorded using Fish2Data. All by-catch was counted by species per pot.
Figure 5: Maturation stages of female Nephrops. Figure was modified from Mjanger et al. (2024).
2.4 - Size-weight converting factors
Size, carapace length for Nephrops and width for crabs, is the main feature measured at surveys and by reference fishers. However, because biomass-based stock assessment methods require weight, converting size to weight based on reliable parameters is necessary. It can be done by the following equation:
W=a*Sb
where W is weight in gram and S is carapace length or width in cm for Nephrops or brown crab, respectively. Length-weight coefficient a and allometric scaling parameter b were derived from the intercept and slope, respectively, from a sex- and species-specific linear model with normal error distribution:
log(W)~log(S)
2.5 - Video survey
In other European countries, Underwater TV surveys (UWTV) are conducted annually for monitoring the state of various Nephrops stocks (ICES, 2023), where Nephrops burrows in the bottom substrate are counted, and the total number of burrows is considered an absolute measure of abundance (Leocádio et al., 2018). Estimates of abundance are dependent on an estimate of catchability, regardless of the survey method. Catches, and thereby the abundance estimates based on pots, are dependent on the target species detecting and entering the gear, which again depends on various abiotic and biotic factors, such as bait, currents, and feeding behaviour. The UWTV survey is therefore a more unbiased method compared to pot surveys. Furthermore, the UWTV survey is a less invasive method, and as it is a common and standardised method across European countries (Leocádio et al., 2018) it provides a solid foundation on which to base a future Norwegian Nephrops monitoring survey.
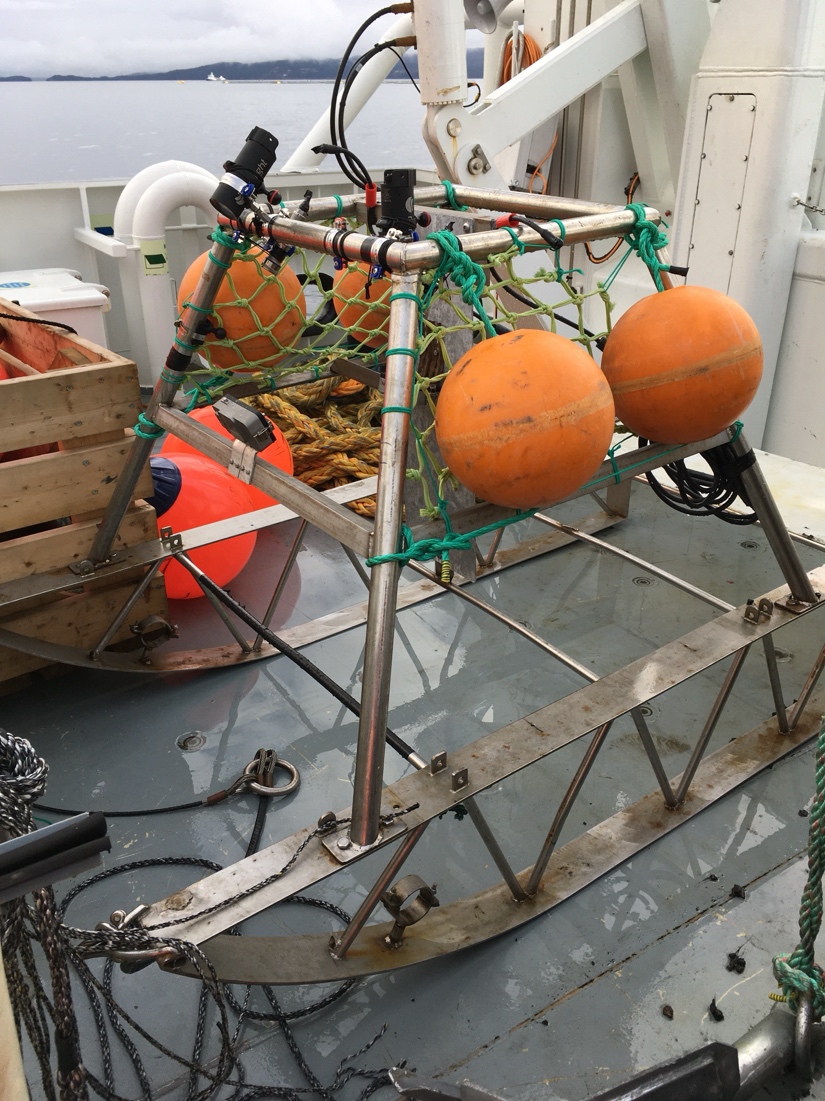
The video sled (Figure 6) used in the 2023 PIA survey was originally constructed for surveying an epibenthic bivalve, the Iceland scallop (Chlamys islandica). To find the best video angel for counting Nephrops burrows in the sediment, a set of two GoPro Hero 8 cameras was mounted on the video sled, one facing forward and the other facing appendicular to the sea floor. The video sled measures 50 cm between the skids and the area between the skids was prolonged forward by two lasers, to ensure consistency in the observation area between the two cameras. The sled was towed for 10 minutes after assumed contact with the sea floor. Since there was no live feed between the sled and the vessel, we assumed bottom contact when the length of the wire equalled the measured bottom depth. During towing, the wire between the sled and the vessel was 1.4 times the depth and the towing speed was kept below 0.7 knots.
All videos were stored and analysed by annotating target species in the annotation program DIVE. The video analysis was conducted in line with the protocol described by Leocádio et al. (2018) and Dobby et al. (2021). However, since this was a pilot study and there was no existing reference library for the area, a simplified analysis with only one untrained video analyst was carried out. Single burrow entrances and burrow complexes, with two or more burrow entrances, as described by Leocádio et al. (2018), were counted as only one observation. Other non-target species that were identified from the videos were also counted.
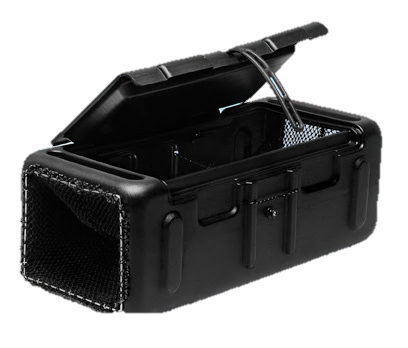
Figure 6: The video sled used for counting Nephrops burrows in the bottom sediment in the 2023 survey in Vestlandet. The two cameras (black) are mounted on top of the sled, one facing forward and one facing appendicular to the sea floor.
2.6 - Environmental measurements
To explore the relationship between catch rates and physical parameters a Conductivity-Temperature-Depth (CTD) profile was conducted at each pot station, after hauling the line of pots. We used the CTD onboard PIA with a maximum speed of 1 m/s on the way down. A full list of CTD stations can be found in Table 3 (Appendix 1).
2.7 - Cross-validation with other data sources
2.7.1 - Brown crab
We compared the catch rates and catch composition from this survey with a 2021 survey in Møre and Trøndelag (Marcussen et al., 2022) and a 2023 survey in Troms (Marcussen et al., 2024). To compare the three crab surveys with the commercial crab fishery, we used the catches from the reference fishers from the same year (2023 and 2021). Every second year a fixed group of crab fishers in the reference fleet self-report catches from four standardized pots. They count and measure all crabs caught per pot. This survey was established in 2001 (Woll et al., 2006). The coverage and number of fishers has been declining and is now limited to a few reference fishers in each of the statistical areas 07, 06 and 08. As of 2023, there are no reference fishers in area 28, which is the same area as the survey area. To compare the catch rates in the reference fishery with the catch rates in the Vestlandet survey, data from fishers in area 08, fishing around Kvitsøy, was used. A crab-specific survey was conducted in Trøndelag in 2021 and in Troms in 2023.
The gill- and fyke net surveys aim to collect data on coastal demersal fish in areas not accessible to bottom trawl and consist of two independent surveys, one from Stad to Rogaland and one Stad to Steigen. Brown crabs are frequently caught as bycatch in the survey but are unwanted because it is very time consuming removing them from the gear when they are occurring in large quantities. Because of the frequent crab catches this survey could provide an appropriate time series for relative crab abundance. However, in 2016, adjustments were made to the gill and fyke net survey, both in terms of gear (lifting the nets from the bottom) and the placement of some stations, to reduce the number of crabs in the nets (Aglen et al., 2018; Eidset, 2019). The expectation was, therefore, that fewer crabs would be found at pot stations in proximity of gill and fyke net stations compared to those that were randomly placed. To evaluate the suitability of the gill and fyke net survey for providing a possible crab abundance index, we compared (i) the relationship between catches of brown crab in the different gears at the same stations and (ii) the catch rates of brown crabs in pots at stations adjacent to gill and fyke net stations compared to randomly placed pot stations. This is a prolongation of an experiment carried out in 2021 (Marcussen et al., 2022). In 2023, only gillnet stations were used.
2.7.2 - Nephrops
We compared the catch rates and stock composition of Nephrops from this survey with an IMR survey in Trøndelag county. IMR has conducted a mapping and tagging study of Nephrops in Frohavet since 2019, a project in collaboration with the fishery program at Guri Kunna High School. The survey was carried out in autumn in 2019–2022, and since 2023 it has been carried out in April–May. We compared the 2023 spring data to the survey data from this study.
To compare the catch rates and catch composition from the two IMR surveys (Frohavet and Vestlandet) to the commercial Nephrops fishery, we used the catches from the reference fishers from 2023. However, in 2023 there were no reference fishers located in the Vestlandet area (statistical area 28) and the four reference fishers were all located in statistical area 07 (Møre og Romsdal county), but south of Frohavet. The reference fishers are asked to register all catches (number of Nephrops per sex) from ten standardized pots during 20 weeks of their fishing, as well as length measure all Nephrops in these pots once per quarter. All data from 2023 was used in the analysis.
3 - Results
3.1 - Brown crab
3.1.1 - Catch rates
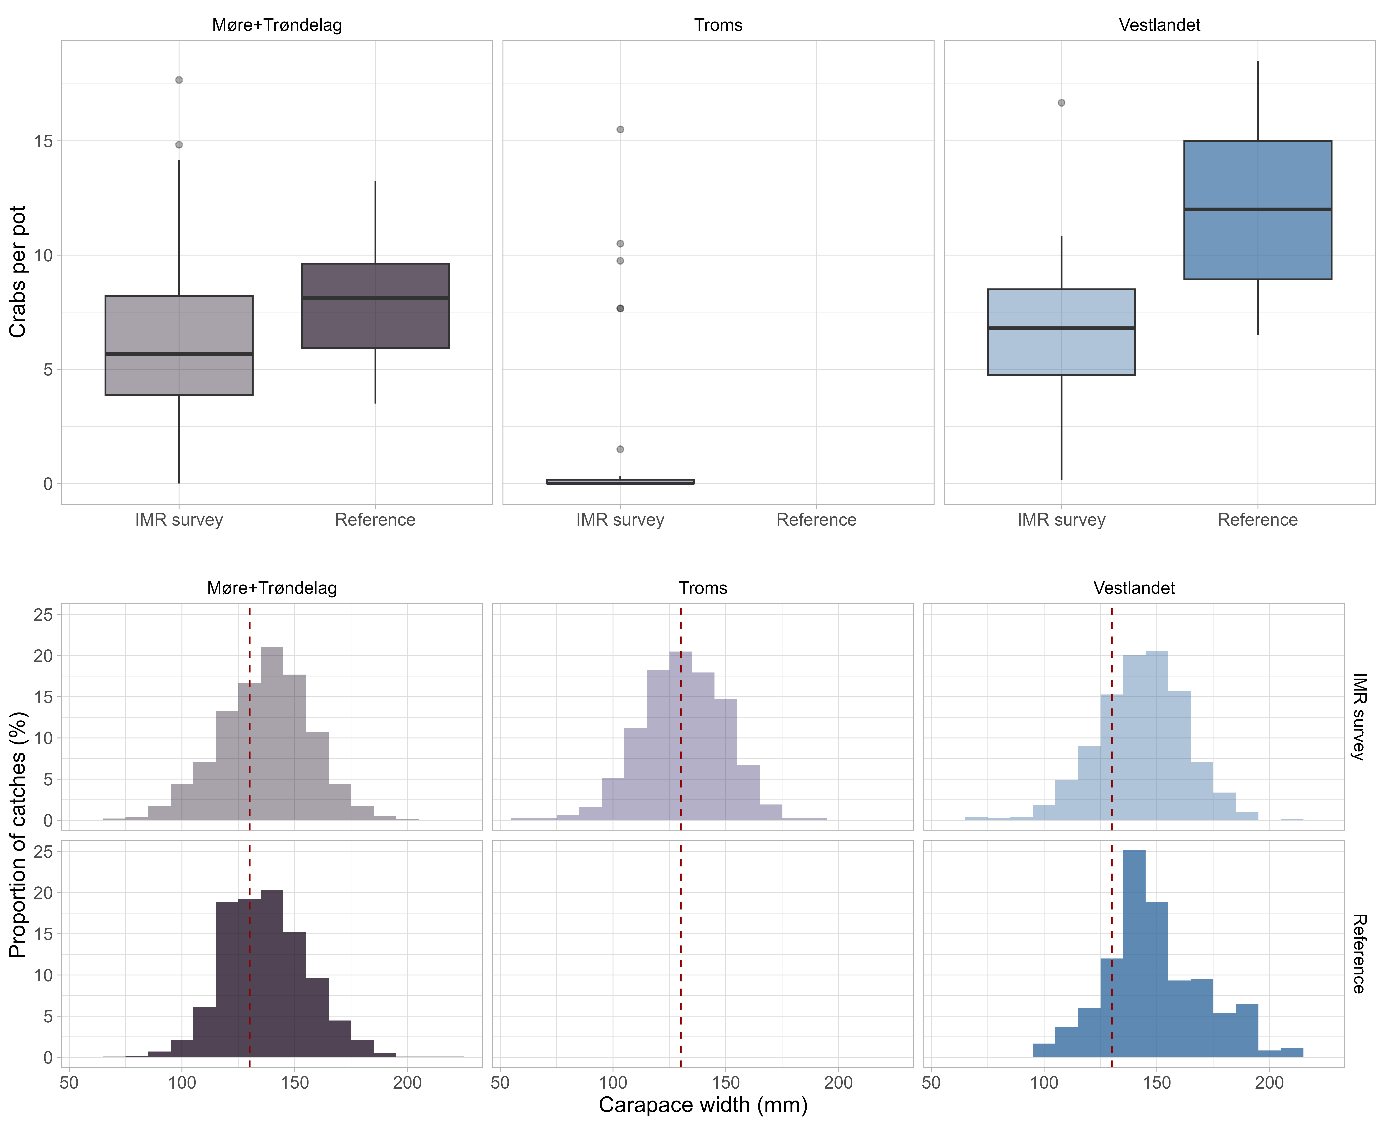
We caught crabs at all 41 stations using crab pots, with a mean across all stations of 6.8 crabs per pot (minimum 0.2, maximum 16.7 (line averages)) (Appendix 3). This is lower than the catch rates found in the reference fishery in Vestlandet (statistical area 08), and more similar to the commercially important crab fishing area in Møre and Trøndelag (Figure 7). The catches and the size distribution from the reference fishers in Vestlandet are not directly comparable to the survey, because they are spatially separated. Furthermore, there are different minimum landing sizes in areas 08 and 28 (130 mm from Vestland county and north; 110 mm from Rogaland county to the Swedish border), which could influence stock demography.
Figure 7: Catch rates (top panel) and size distribution (lower panel) for brown crab (Cancer pagurus) in the three surveys Møre and Trøndelag (2021), Troms (2023) and Vestlandet (2023) compared to the reference fishery in the same regions for 2021 and 2023, respectively. The dashed line indicates the minimum landings size (130 mm). There were no reference fishers in Troms in 2023.
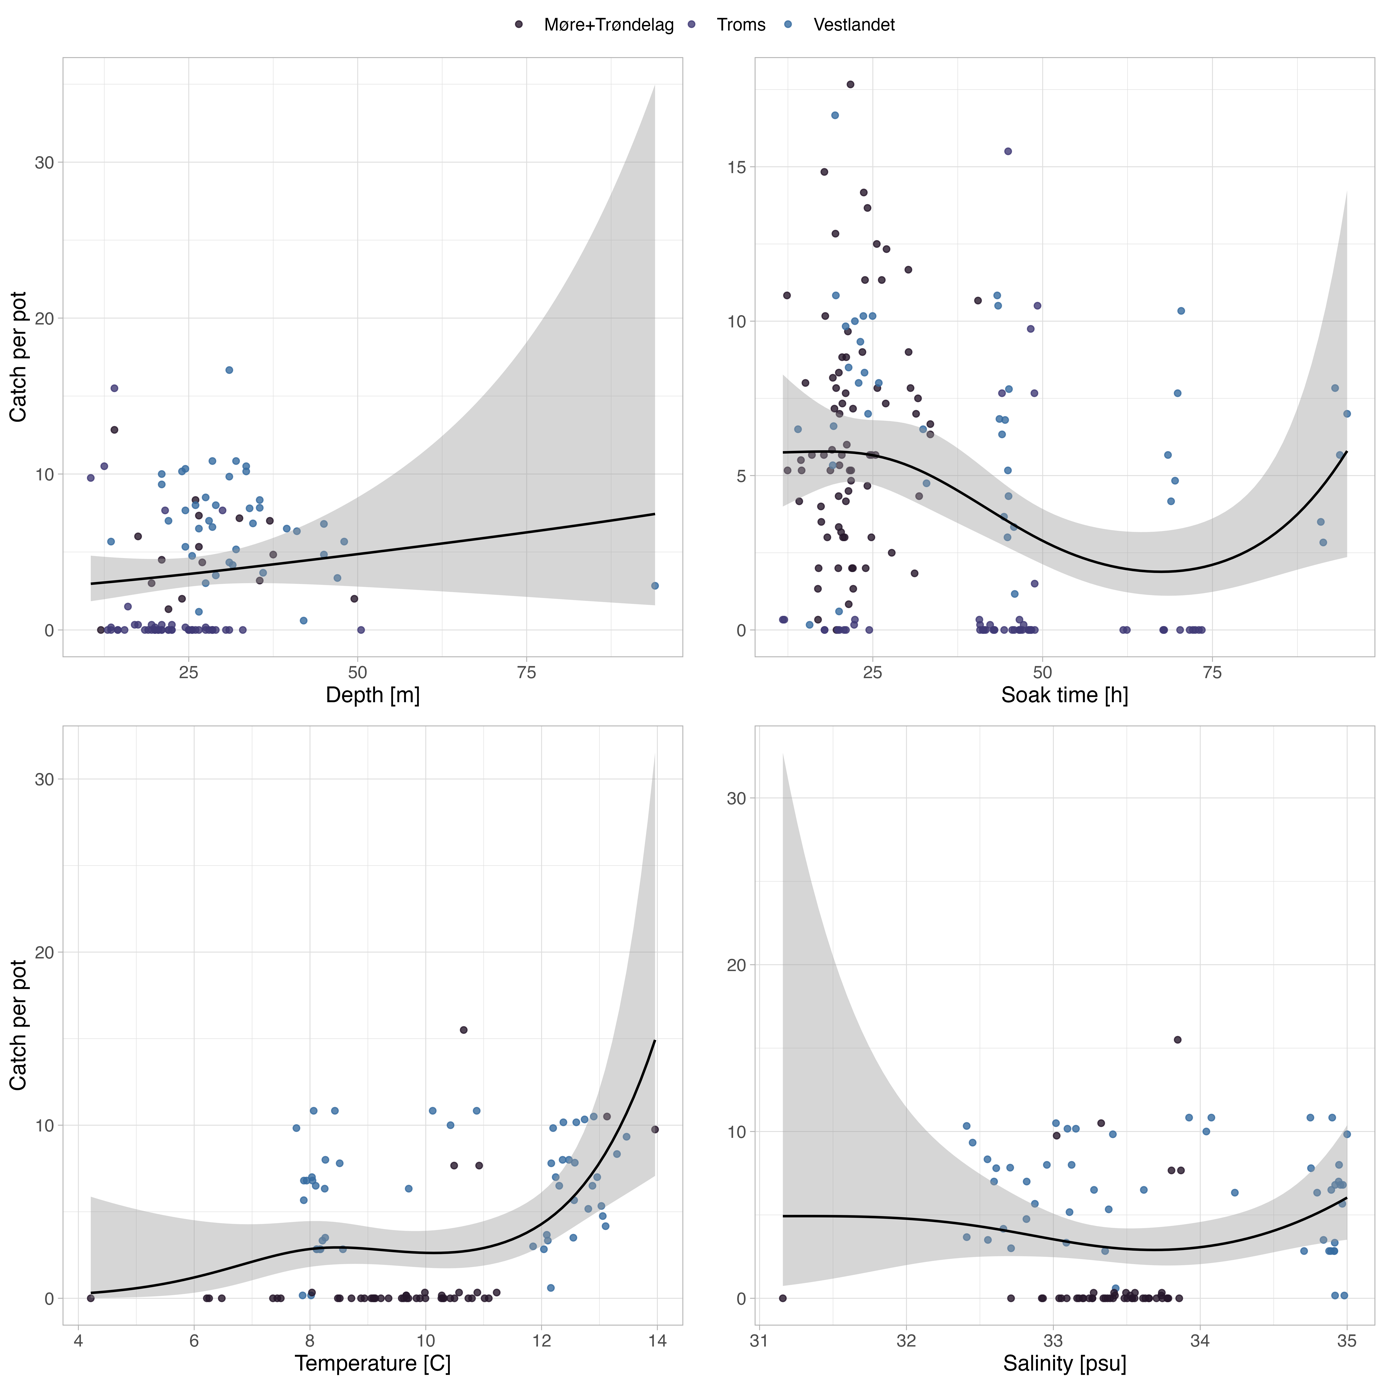
We evaluated the crab catch rates in relation to depth, soak time, bottom temperature and salinity for the three IMR surveys combined (Figure 8). There was no clear effect of depth or salinity, but we found a significant nonlinear effect of soak time and a strong positive correlation between temperature and number of crabs per pot in the Troms and Vestlandet surveys combined. From the Troms survey, we have previously described a positive relationship between probability of presence and temperature (Marcussen et al., 2024). Combined with the data from Vestlandet, this relationship is reflected in the catch rates. However, mainly the catches (especially the stations with zero catches) from Troms caused the contrast in the data and, hence, the significant relationship. There was no effect of temperature on catch rates when only Vestlandet was included. It is therefore likely that temperature is less important in determining distribution and abundance at Vestlandet compared to Troms, where temperature is at the lower temperature limits for crabs (Bakke et al., 2019). The soak time effect indicates increased catch rates with longer soak time but stagnated at soak times above 24 hours and dropped towards zero at the longest soak times (>50 hours). The up at the end is manly driven by generally high catches at all stations in the Vestlandet survey, where the soak time effect is not as pronounced as in the two other surveys. As the soak time effect was not tested systematically during the three surveys it is not clear whether the strong decrease at long soak times reflects an actual trend or an artifact of few stations with particularly long soak times at sites with low crab densities. A diminishing return in terms of catch rates after 1–2 days could be expected due to deteriorating or eaten up bait, overcrowding of pots, etc., while an absolute decrease is assumed unlikely as there is a low probability of crabs escaping the pots. The effect of depth on catch rate was not explored systematically and lacked contrast in deeper waters, as we only had one crab station in waters deeper than 50 m.
Figure 8: Average number of brown crab (Cancer pagurus) per pot in each station in relation to depth, soak time and bottom temperature and salinity. The different surveys and regions are separated by colours. The black line and the grey area represent the mean and 95 % confidence interval, respectively. The line is generated by the stat_smooth function in ggplot, with a generalized additive mixed model y~s(x, k= 4) and a tweedie error distribution. Temperature and salinity were measured near the bottom at the same location as the pot lines with a CTD.
3.1.2 - Catch composition
The size distribution of brown crabs in the Vestlandet survey was similar to the size distribution from the reference fishery at Vestlandet, as well as the two earlier pot surveys of IMR, in Møre and Trøndelag, and Troms, respectively (Figure 7). The female crabs were in general larger than the male crabs (mean sizes of 147 mm and 138 mm, respectively). Compared to the size distribution from a survey in 1960–1961 in Hjeltefjorden and Byfjorden, the crabs caught in 2023 were smaller than in the 1960s (Gundersen, 1962). This could indicate a size truncation, however, during the survey in the 1960s, fyke nets were used and they could have a different size selectivity than the pots.
There were more females than males in the pot catches in the Vestlandet survey. A female-dominated sex ratio was also recorded in the IMR survey in Møre and Trøndelag in 2021. In the Vestlandet survey, female crabs comprised 58% of the catch, while the proportion of females was 45 and 60%, for Troms, and Møre and Trøndelag, respectively. Comparing with the survey in the 1960s, the proportion of females was larger in the fyke net survey from 1960–1961, ranging from 57 to 88% of the catches during October–November (Gundersen, 1962).
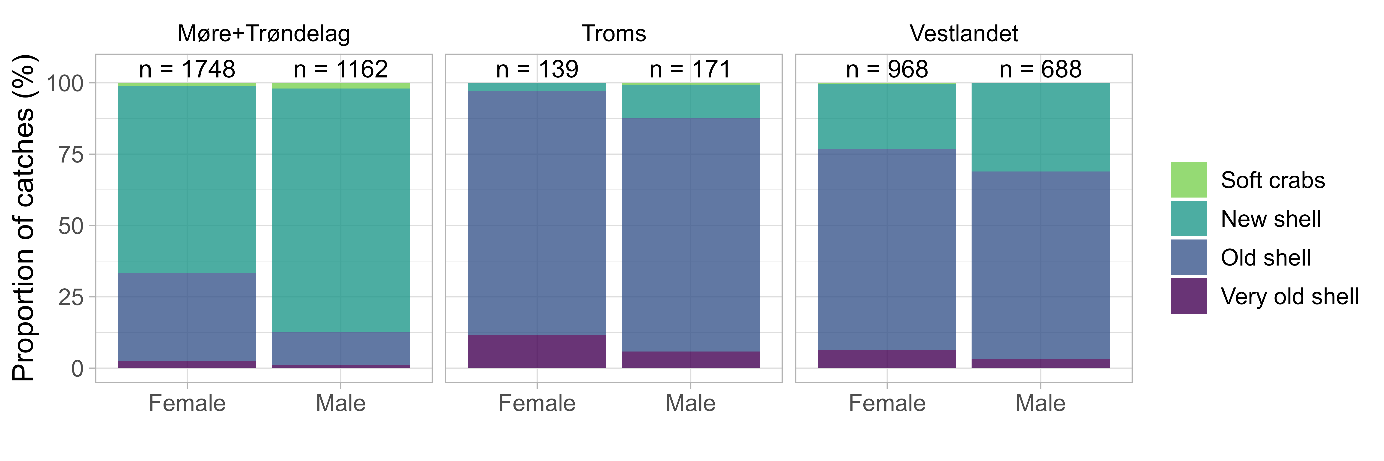
The majority of crabs registered on the Vestlandet survey had old shells. In total, 68% of the crabs had old or very old shells, which is less than in the Troms survey but much higher than on the important commercial fishing grounds around Møre and Trøndelag (Figure 9). However, both space and time may explain the differences as the three surveys were conducted at slightly different times of the year. Whereas the Møre and Troms surveys were conducted in late August, the Vestlandet survey was conducted in mid-October. Season can affect both sex and shell age composition at the fishing depths, as crabs moult in autumn and aggregate to mate during the same period (Gundersen, 1962, Woll et al., 2006). In August, moulting seems to be well underway in Møre and Trøndelag, whereas it has barely commenced in Troms. The registration of many old shells in Vestlandet in October could indicate that moulting took place several months before the survey.
Figure 9: Shell age composition in the total catches of brown crab (Cancer pagurus) from the three IMR crab surveys in Møre and Trøndelag (August 2021), Troms (August 2023) and Vestlandet (October 2023).
We measured the sex-specific relationship between weight and carapace width of brown crabs based on 887 female and 592 male crabs during the survey at Vestlandet (Appendix 4). Males are in general heavier than same-sized females after sexual maturation. This is likely due to differences in development in sexual traits, where males grow larger, thus, heavier claws than females (Bennet & Brown, 1982). The estimated sex-specific width-weight parameters can be found in Table 4 (Appendix 4). As an example, a male and a female at minimum landings size (13 cm) would have an estimated weight of 339 and 356 grams, respectively.
3.1.3 - Damaged and infested crabs
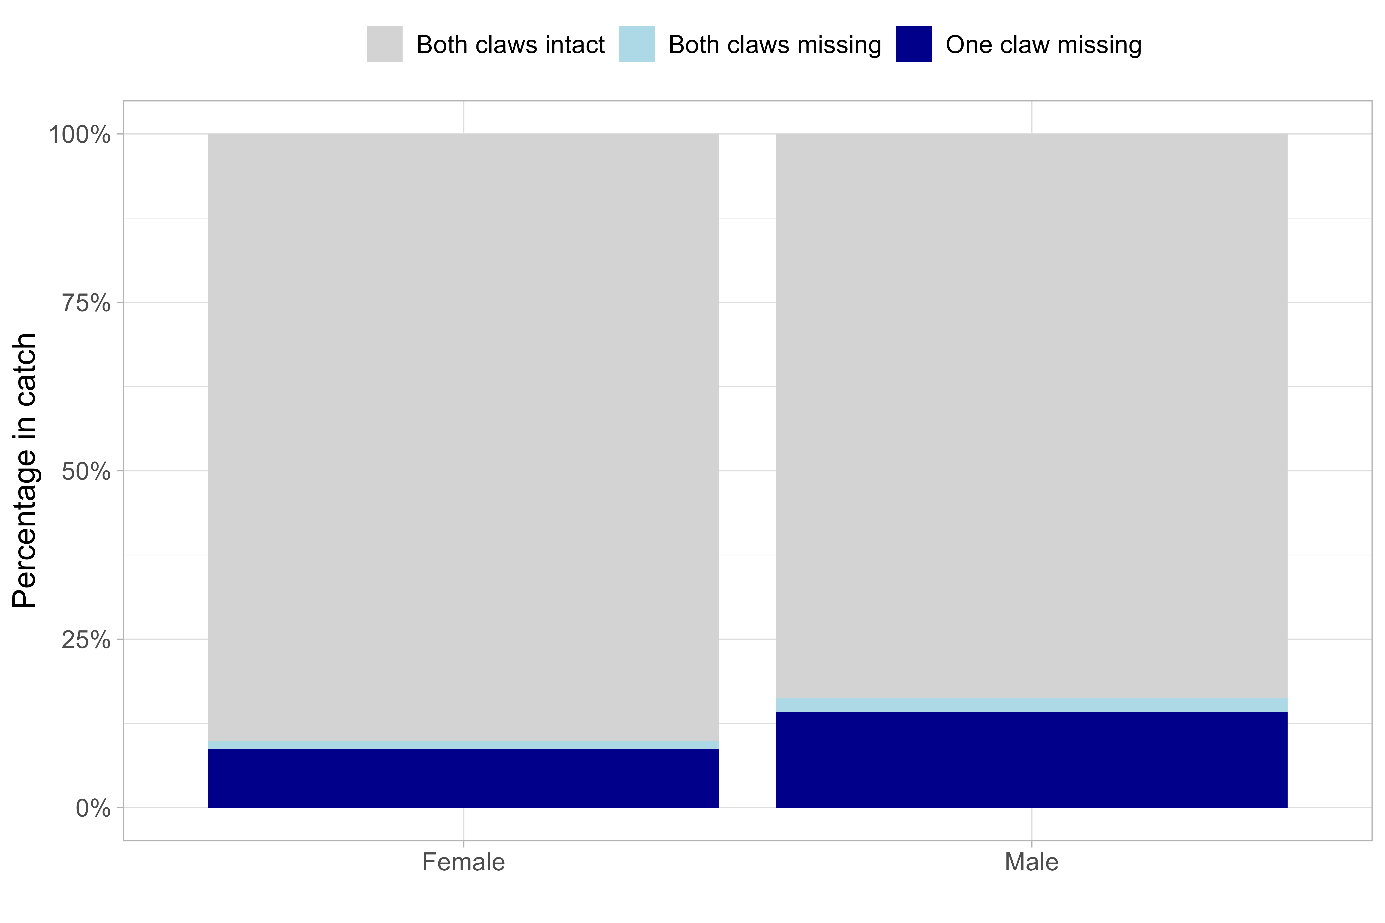
Male crabs were more often than females found with one or two claws missing (Figure 10). In average, 16% of male crabs had one (14%) or both (2%) claws missing, compared to 10% of females (9 and 1%). There was spatial clustering in the occurrence of missing claws: while there were stations with very high proportions of missing claws, including one where only 36% of females had both claws intact, there were 24 stations where no crab had any missing claws.
If claws or legs of a crab are trapped by predation or physical entanglement, the limb can fall of at a natural “break-off” point, known as autotomy. This is an efficient distraction-manoeuvre, where a predator is left with the leg while the crab escapes. However, if the claw or leg is ripped off or damaged on the inside of the “break-off” point of autotomy the crab will suffer from bleeding and possibly bleed out. This is the case when fishers break off claws to keep and discard the rest of the crab alive. A first step and an indication in knowing if this is an allegedly common practice, was to register all crabs with one or two claws missing. However, we did not classify the break-of-points and can therefore not conclude if the claws were lost due to autotomy or other external forces.
Figure 10: Proportion of female and male brown crabs (Cancer pagurus) with one or two claws missing during the IMR survey at Vestlandet 2023.
More crabs with black spot disease including several cases with severe degradation of the shell and abdomen were observed (Figure 11) compared to the other two IMR crab surveys (Trøndelag 2021 and Troms 2023), based on experience of the observers. Black spot disease was not registered systematically, but we recommend investigating its prevalence further and report it systematically in future studies. The black spot disease is a shell disease caused by a microbial community infecting and degrading the chitin in the shell. This can cause unsightly lesion and in worst cases cause death (Vogan et al., 2008). The marketability of the crab as resource is reduced (Rowley et al., 2014). High prevalence of crabs with black spot disease has been described as a potential effect of overpopulation and could therefore possibly be reduced by increased fishery (Ayres & Edwards, 1982).
Figure 11: Brown crabs with varying degrees of black spot disease captured during the Vestlandet survey in 2023.
3.1.4 - Comparing catches from gillnet and pots
One objective of the Vestlandet survey was to compare crab catch rates at positions where the gill and fyke net survey conducts stations with random locations to explore whether the gill and fyke net survey samples representative crab areas. Previous analysis (Marcussen, 2022) showed negatively biased crab catches at gill and fyke net locations in Møre and Trøndelag in 2021. However, the survey in Vestlandet in 2023 could not be conducted in parallel with the gill and fyke net survey, resulting in fewer stations at or close to gill net stations. In addition, the timing differed and fyke nets were not deployed, further reducing the comparability. Only 8 crab pot stations were close (< 1 km) to a gill net station and only 3 of them in direct proximity (< 0.5 km), all of them in the same area in northern Øygarden.
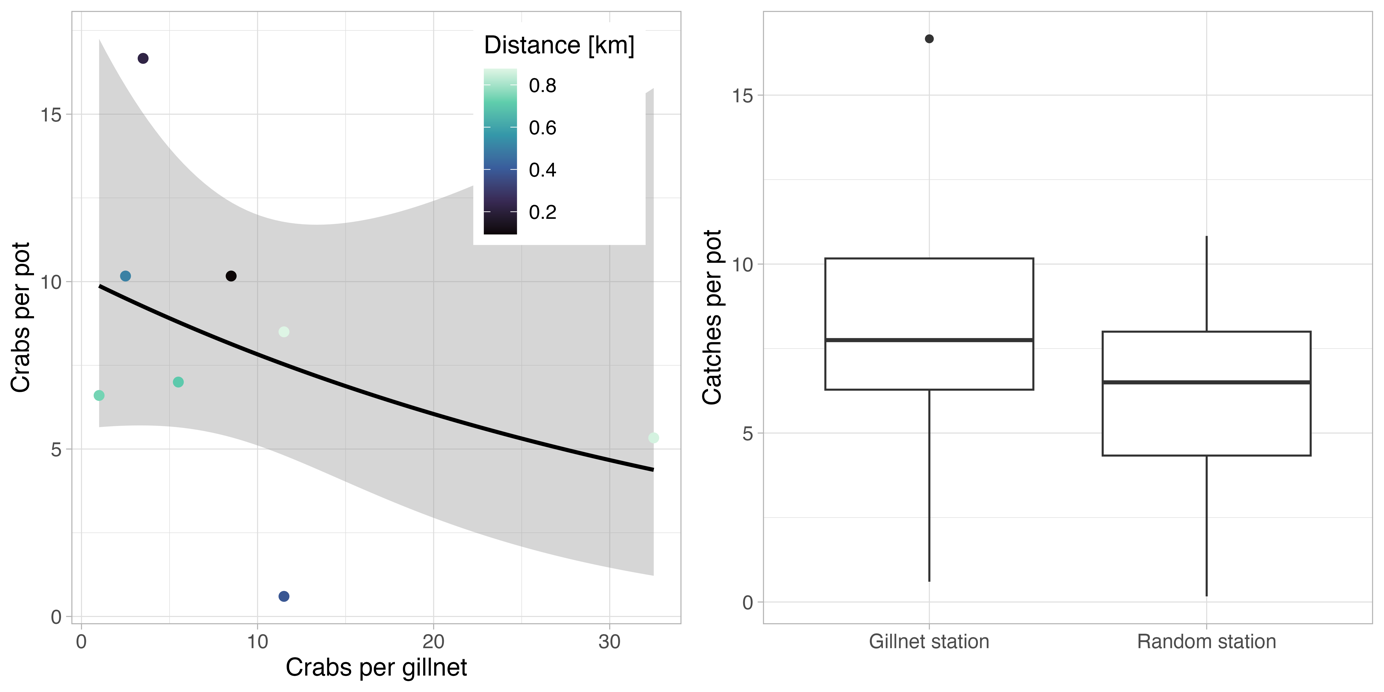
The results from the limited data available showed no clear relationship between catch rates in crab pots and gill nets but slightly higher catch rates near gill net stations compared to all other, randomized stations (Figure 12). However, because of the low sample size, it is difficult to disentangle potential effects of gear types as well as survey design and sites, from an area effect of northern Øygarden. Nevertheless, the pilot study conducted during our 2023 survey suggests that in Vestlandet there might not be the same negative bias as in the gill and fyke net survey north of Stad. For Vestlandet, crab catches in the gill and fyke net survey might therefore possibly be more suitable for a stock size index. We recommend further, more comprehensive and systematic investigations to test this hypothesis.
Figure 12: Relationship between crab catches per pot and gillnet at the stations closest to each other (left) and crab catch rates at pot stations close to where gillnets were set (“Gillnet station”) or at randomized positions (“Random station”) (right).
3.2 - Nephrops
3.2.1 - Catch rates
The catch rate of Nephrops varied substantially between the different data sets (investigations). Median number of Nephrops per pot was lower in the Frohavet survey in April–May 2023 than in the Vestlandet survey (Figure 13). The variation in catch rate was, however, higher in Vestlandet. This could be explained by the randomly selected stations on shrimp fields around Bergen, while the pot survey in Frohavet takes place in a rather small area (pot-fishing area of the school) within an important commercial fishing ground. In Frohavet, the pots cannot be placed at random as the area is packed with commercial pot lines. The catch rates from the reference fishery in Møre were slightly higher and less variable than what we observed in the survey in Vestlandet.
Figure 13: Catch rates (number of Nephrops per pot) in the survey in Frohavet in April–May 2023 (black), from the reference fishery in Møre in 2023 (green) and in Vestlandet in October 2023 (blue). The boxplot shows median catch rate with 25 and 75% quartiles while the line shows 1,5 x the inter quartile range.
3.2.2 - Size and sex composition
The female Nephrops were in general smaller than the male Nephrops (mean sizes of 48 mm and 56 mm, respectively). There were both smaller, as well as larger specimens in the pot catches in Frohavet in spring 2023 compared with the catches in Vestlandet (Figure 13). It is not relevant to compare the size distribution from the reference fishery to the two other surveys, due to low sample size in the reference fishery.
The proportion of female Nephrops was lower than the male proportion in the catches in the survey at Vestlandet, similar to the survey in Frohavet in 2023. Female Nephrops comprised 32% of the catches in Vestlandet, while the proportion of females in the survey in Frohavet was only 11%. A low proportion of females in Nephrops catches is known from several studies and areas and can vary throughout the breeding cycle (Figueiredo & Thomas, 1967). The majority of the female Nephrops in Vestlandet had white or yellow gonads, in total 33%, whereas in Frohavet the majority of the female Nephrops had visible green gonads (Figure 14). These differences could be related to seasonal maturation patterns. Nephrops spawn and mate in late summer (Farmer, 1974), after which the fertilized eggs are carried under the tail until hatching. Females of all maturation stages were captured both in spring and autumn which indicates that the spawning cycle in Norwegian coastal waters lasts longer than a year (see also Farmer, 1974). A relatively high proportion of females with unripe gonads in October (Vestlandet) and few females with unripe gonads in spring (Frohavet) suggests that ripening of the gonads take place over winter, followed by spawning in summer. A small proportion of berried females were recorded in October, but berried females are known to stay hidden in their burrows.
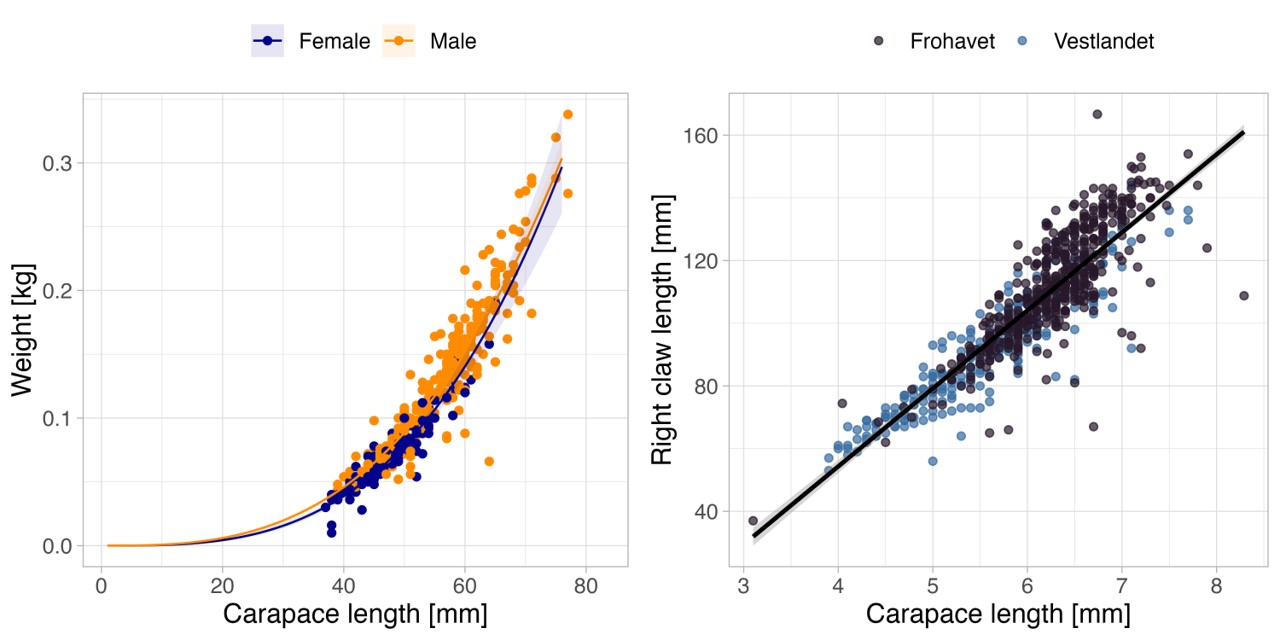
We measured and weighed 697 and 396 Nephrops during the surveys in Frohavet and Vestlandet, respectively (Appendix 4). There was a similar relationship between size and weight for males and females in Vestlandet. Furthermore, there was a similar relationship between size (carapace length) and claw length for males in both survey regions.
Figure 14: Sex-specific size composition of Nephrops in the surveys in Frohavet (April–May 2023), from the reference fishery in Møre in 2023, and the IMR survey on Vestlandet (October 2023). The colours indicate maturation stages for female Nephrops (see Figure 5). The dashed line represents the minimum landing size, 40 mm carapace length. Note that the y-axis is different between the sexes.
3.2.3 - Video observations
During the survey we tested a towed video sled to estimate density of Nephrops , by counting burrows in the bottom sediment and comparing that to catches in nearby pot stations. Four tows were completed successfully. A successful tow was characterised by the sled being in contact with the sea floor, with the cameras facing down and with good visibility of the sea floor. It was possible to detect burrows from both the forward and downward-facing cameras. Because of varying quality of the videos of the forward facing and downward facing cameras in the same run in two of the hauls it was not possible to directly compare the two video angles (Figure 15). The reason for the low quality of the videos was mainly low visibility due to high turbidity caused by the wire dragging in front of the video sled.
We aimed to compare the catches/recordings from adjacent stations of video and pots, but since the comparison is based on only four hauls, no conclusions can be drawn (Figure 16). Whereas the pots provide number of Nephrops, the video gives number of burrows or burrow complexes. It is uncertain whether individuals utilize one or more burrow systems.
Figure 15: Overview of the number of Nephrops burrows/burrow complexes counted, and individuals of other identified taxa in each of the four videos (the facet name indicates the serial number for each haul). Colours indicate the angle of the camera, facing either forward (yellow) or downward (purple).
Figure 16: Comparing number of Nephrops per pot to each adjacent video stations, to evaluate/estimate gear coefficient.
3.3 - By-catch
The pot fisheries for both brown crab and Nephrops are relatively selective for the target species. However, there are some occurrences of other species in the pots (Table 1). The most frequent by-catch species/group were Munida and red sea cucumber (Parastichopus tremulus) in the brown crab pots and Nephrops pots, respectively. There were three occurrences of European lobster in the brown crab pots.
Table 1. All identified taxa (in number) in crab and Nephrops pots during the survey in Vestlandet in 2023. Names are given in latin and as Norwegian common names.
Scientific name
Species (NO)
Gear
Number
Asteroidea
Sjøstjerner
Pots (Nephrops)
2
Asteroidea
Sjøstjerner
Pots (crab)
4
Buccinidae
Kongsnegl
Pots (Nephrops)
2
Cancer pagurus
Taskekrabbe
Pots (crab)
1420
Carcinus maenas
Strandkrabbe
Pots (crab)
1
Caridea
Reker
Pots (crab)
4
Cephalopoda
Blekkspruter
Pots (Nephrops)
1
Conger conger
Havål
Pots (crab)
3
Echinus esculentus
Rød kråkebolle
Pots (crab)
1
Helicolenus dactylopterus
Blåkjeft
Pots (Nephrops)
2
Homarus gammarus
Europeisk hummer
Pots (crab)
3
Labridae
Leppefisk
Pots (crab)
3
Munida
Trollhummer
Pots (Nephrops)
1
Munida
Trollhummer
Pots (crab)
63
Myxine glutinosa
Slimål
Pots (crab)
3
Nephrops norvegicus
Sjøkreps
Pots (Nephrops)
383
Parastichopus tremulus
Rødpølse
Pots (Nephrops)
7
Portunidae
Svømmekrabber
Pots (crab)
1
Squalus acanthias
Pigghå
Pots (crab)
2
Trisopterus minutus
Sypike
Pots (crab)
1
4 - Acknowledgements
We greatly appreciate the help from the research group Fangst, by Terje Jørgensen and Jostein Saltskår, during the planning and preparation of the survey. Fangst, as well as Lars Asplin, kindly lent us equipment. Jostein Saltskår spent many hours rigging the Nephrops pot lines. The help with the testing of the new survey method, video, would not have been possible without the help provided by Erich Schultz. We are grateful to the crew on PIA for all the support, technical assistance and help in handling the gear, including the operations in which lost pot lines were cleverly found and retrieved. The IMR crew on the docks and research vessels helped us with the logistics of transportation of the pots and other equipment. This work was supported by the project Coastal shellfish resources (project no. 15619) in the Coastal research program at IMR.
5 - References
Aglen, A., Nedreaas, K., and Otterå, H. 2018. Oppvekst – og leveområder for kystnære bestander fra Ryfylke til Vestfjorden. Internal report by Institute of Marine Research.
Ayres, P., and Edwards, E. 1982. Notes on the distribution of “black spot” shell disease in crustacean fisheries. Chem Ecol 1:125–130.
Bakke S, Siikavuopio SI and Christiansen JS. 2019. Thermal behaviour of edible crab Cancer pagurus Linnaeus, 1758 in coastal Norway. Fauna norvegica 39: 1–11.
Chapman, C. J. 1980. Ecology of juvenile and adult Nephrops . In The biology and management of lobsters: Ecology and Management, 2, pp. 143–179.. Ed. by Cobb, J., and Phillips, B. Academic Press, Inc, New York.
Dobby, H., Doyle, J., Jónasson, J., Jonsson, P., Leocádio, A., Lordan, C., Weetman, A., and Wieland, K. 2021. ICES Survey Protocols – Manual for Nephrops underwater TV surveys, coordinated under ICES Working Group on Nephrops Surveys (WGNEPS). ICES Techniques in Marine Environmental Sciences Vol. 65. 44 pp. https://doi.org/10.17895/ices.pub.8014.
Eidset, E. 2019. Can catch data from small meshed gears in shallow waters be used to estimate recruitment indices of Norwegian coastal cod, Northeast Arctic saithe and pollack along the Norwegian coast? The University of Bergen.
Eiriksson H. 2014. Reproductive biology of female Norway Lobster, Nephrops norvegicus (Linnaeus, 1758) Leach, in Icelandic waters during the period 1960–2010: comparative overview of distribution areas in the Northeast Atlantic and the Mediterranean. Advances in Marine Biology, 68: 65–210.
Farmer, A. S. D. 1974. Synopsis of biological data on the Norway lobster Nephrops norvegicus (Linnaeus, 1758). FAO Fisheries Synopsis No. 112. Rome, September 1975. 108 pp.
Figueiredo, M. J., and Thomas, H. J. 1967. Nephrops norvegicus (Linnaeus, 1758) leach - a review. Oceanography Marine Biology Annual Review, 5: 371–407.
Gundersen, K. R. 1962. Undersøkelser av krabbe ( Cancer pagurus L.) i farvannene ved Bergen i årene 1959-60.
ICES. 2023. Working Group on the Assessment of Demersal Stocks in the North Sea and Skagerrak (WGNSSK). ICES Scientific Reports. 5:39. 1536 pp. https://doi.org/10.17895/ices.pub.22643143
ICES. 2024. Benchmark workshop 3 on the development of MSY advice using SPiCT (WKBMSYSPiCT3). 10.17895/ices.pub.24998858.v1
Kleiven, Alf Ring, et al. "Technological creep masks continued decline in a lobster (Homarus gammarus) fishery over a century." Scientific reports 12.1 (2022): 3318.
Leocádio, A., Weetman, A., and Wieland, K. (Eds). 2018. Using UWTV surveys to assess and advise on Nephrops stocks. ICES Cooperative Research Report No. 340. 49 pp. https://doi.org/10.17895/ices.pub.4370
Marcussen, J. B. 2022. Fishing for more data: Exploratory stock assessment of the data-limited brown crab ( Cancer pagurus ) stock in Norway. University of Agder.
Marcussen, J. B., Jenssen, M., Nedreaas, K., Søvik, G. and Zimmermann, F. 2022 Taskekrabbetokt: Molde – Frøya 2021. Havforskningsinstituttets første taskekrabbetokt. Toktrapport fra Havforskningen nr. 12-2022. ISSN:1503-6294. 23 s. https://www.hi.no/templates/reporteditor/report-pdf?id=63342&36859728
Marcussen, J. B., Bakke, S., Olsen, S. A., Skardhamar, J., & Zimmermann, F. 2024. Krabbespredning i nord-Toktrapport 2023200030. Toktrapport fra Havforskningen nr. 3-2024. ISSN: 1503-6294. https://hdl.handle.net/11250/3126448.
Mjanger, H., Svendsen, B .V., Fuglebakk, E., Gulbrandsen, M. L., Diaz, J., Johansen, G. O., Vollen, T., Bruck, S. A., Gundersen, S., and Bjånes, C. E. 2024. Håndbok for prøvetaking av fisk, krepsdyr og andre evertebrater. https://hi.dkhosting.no/docs/pub/DOK05957.pdf
Leocádio, A., Weetman, A., and Wieland, K. (eds.). 2018. Using UWTV surveys to assess and advise on Nephrops stocks. ICES Cooperative Research Report No. 340. 49 pp. https://doi.org/10.17895/ices.pub.4370
Rowley, A.F., Cross, M.E., Culloty, S.C., Lynch, S.A., Mackenzie, C.L., Morgan, E., O'Riordan, R.M., Robins, P.E., Smith, A.L., Thrupp, T.J., Vogan, C.L., Wootton, E.C., and Malham, S.K. 2014. The potential impact of climate change on the infectious diseases of commercially important shellfish populations in the Irish Sea—a review. ICES J Mar Sci 71:741–759.
Søvik, G., Falkenhaug, T., Zimmermann, F., Gallo, N.D., Nedreaas, K., Danre, J.-B., Hovland, T., Thangstad, T. H., Olsen, S. Aa., Johnsen, E., and Asplin, L. 2023. Toktrapport fra økosystemtokt i vestlandsfjordene. Hydrografi, vannkjemi, reker, krill, bunnfisk, tobis og perifylla. Toktrapport nr. 11 2023. 104 s. ISSN:1503-6294. https://www.hi.no/hi/nettrapporter/toktrapport-2023-11
Vogan, C.L., Powell, A., and Rowley, A.F. 2008. Shell disease in crustaceans - just chitin recycling gone wrong? Environ Microbiol. Apr;10(4):826-35.
Woll, A. K., van der Meeren, G. I., & Fossen, I. 2006. Spatial variation in abundance and catch composition of Cancer pagurus in Norwegian waters: biological reasoning and implications for assessment. ICES Journal of Marine Science , 63 (3), 421-433.
6 - Annex
6.1 - Appendix 1 – Station lists
Table 2. List of all stations on the Vestlandet survey in October 2023 by gear type, with station and serial number and latitude and longitude.
Station nr.
Serial number
Long
Lat
Gear
1
57501
5.21
60.13
Nephrops pot
2
57502
5.19
60.13
Nephrops pot
3
57503
5.18
60.12
Nephrops pot
4
57504
5.20
60.13
Brown crab pot
5
57505
5.20
60.14
Brown crab pot
6
57506
5.20
60.15
Brown crab pot
7
57507
5.18
60.15
Brown crab pot
8
57508
5.18
60.14
Brown crab pot
9
57509
5.18
60.14
Brown crab pot
10
57510
5.17
60.13
Brown crab pot
11
57511
5.17
60.12
Brown crab pot
12
57512
5.20
60.09
Brown crab pot
13
57513
5.18
60.09
Brown crab pot
14
57514
5.18
60.07
Nephrops pot
15
57515
5.15
60.07
Nephrops pot
16
57516
5.16
60.06
Nephrops pot
17
57517
5.17
60.04
Nephrops pot
18
57518
5.19
60.02
Nephrops pot
19
57519
5.14
60.05
Nephrops pot
20
57520
5.11
60.07
Nephrops pot
21
57521
5.24
60.14
Brown crab pot
22
57522
5.25
60.11
Brown crab pot
23
57523
5.17
60.09
Brown crab pot
24
57524
5.15
60.09
Brown crab pot
26
57526
5.26
60.13
Nephrops pot
27
57527
5.27
60.13
Nephrops pot
28
57528
5.26
60.14
Nephrops pot
29
57529
5.10
60.11
Brown crab pot
30
57530
5.13
60.10
Brown crab pot
31
57531
5.13
60.10
Brown crab pot
32
57532
5.12
60.09
Brown crab pot
33
57533
5.12
60.09
Brown crab pot
34
57534
5.19
60.02
Brown crab pot
35
57535
5.21
60.01
Brown crab pot
36
57536
5.23
60.22
Nephrops pot
37
57537
5.25
60.23
Nephrops pot
38
57538
5.28
60.24
Nephrops pot
39
57539
5.33
60.26
Brown crab pot
40
57540
5.29
60.25
Brown crab pot
41
57541
5.27
60.23
Brown crab pot
42
57542
5.26
60.24
Brown crab pot
43
57543
5.17
60.26
Nephrops pot
44
57544
5.18
60.27
Nephrops pot
45
57545
5.14
60.27
Nephrops pot
46
57546
5.22
60.13
Video
47
57547
5.22
60.13
Video
48
57548
5.27
60.13
Video
49
57549
5.27
60.13
Video
50
57550
5.27
60.14
Video
51
57551
5.26
60.14
Video
52
57552
5.08
60.46
Nephrops pot
53
57553
5.08
60.45
Brown crab pot
54
57554
5.06
60.45
Brown crab pot
55
57555
5.06
60.42
Nephrops pot
56
57556
5.10
60.42
Nephrops pot
57
57557
5.12
60.42
Brown crab pot
58
57558
5.09
60.43
Brown crab pot
59
57559
5.13
60.43
Nephrops pot
60
57560
5.15
60.44
Brown crab pot
61
57561
5.16
60.44
Brown crab pot
62
57562
5.14
60.27
Video
63
57563
4.92
60.54
Nephrops pot
64
57564
4.91
60.58
Nephrops pot
65
57565
4.93
60.56
Nephrops pot
66
57566
4.86
60.59
Brown crab pot
67
57567
4.85
60.58
Brown crab pot
68
57568
4.83
60.57
Brown crab pot
69
57569
4.81
60.58
Brown crab pot
70
57570
4.79
60.58
Brown crab pot
71
57571
4.77
60.63
Brown crab pot
72
57572
4.77
60.62
Brown crab pot
73
57573
4.79
60.63
Brown crab pot
74
57574
4.79
60.62
Brown crab pot
75
57575
4.78
60.62
Brown crab pot
Table 3. List of all CTD stations on the Vestlandet survey in October 2023, with CTD station number, latitude and longitude (decimal degrees) and depth (m).
Station nr.
Long
Lat
Depth
90
5.20
60.13
52.53
91
5.20
60.13
52.42
92
5.20
60.13
184.49
93
5.20
60.13
40.97
94
5.18
60.12
138.79
95
5.18
60.13
195.00
96
5.22
60.13
101.23
97
5.24
60.14
33.34
98
5.18
60.14
47.41
99
5.17
60.14
31.18
100
5.17
60.12
44.25
101
5.19
60.09
43.87
102
5.20
60.09
29.08
103
5.21
60.01
57.14
104
5.19
60.02
155.92
105
5.14
60.05
196.12
106
5.16
60.06
123.34
107
5.18
60.08
134.75
108
5.15
60.07
166.24
109
5.10
60.08
177.34
110
5.16
60.09
39.10
111
5.26
60.13
215.70
112
5.16
60.04
247.51
113
5.12
60.09
28.15
114
5.10
60.11
25.63
115
5.25
60.11
39.63
116
5.26
60.12
159.13
117
5.17
60.26
190.62
118
5.18
60.27
169.26
119
5.14
60.27
226.48
120
5.23
60.22
213.73
121
5.25
60.23
178.09
122
5.27
60.23
34.60
123
5.26
60.24
89.27
124
5.28
60.25
137.81
125
5.29
60.25
39.63
126
5.32
60.26
48.15
127
5.07
60.45
48.23
128
5.09
60.43
31.50
129
5.12
60.42
37.81
130
5.15
60.44
40.09
131
5.07
60.46
248.18
132
4.76
60.63
33.73
133
4.79
60.63
43.87
134
4.79
60.58
31.56
135
4.81
60.58
59.54
136
4.83
60.58
41.00
137
4.85
60.58
35.84
138
4.86
60.59
38.95
139
4.92
60.55
235.74
140
5.12
60.43
193.65
6.2 - Appendix 2 - Schematic overview of pot lines
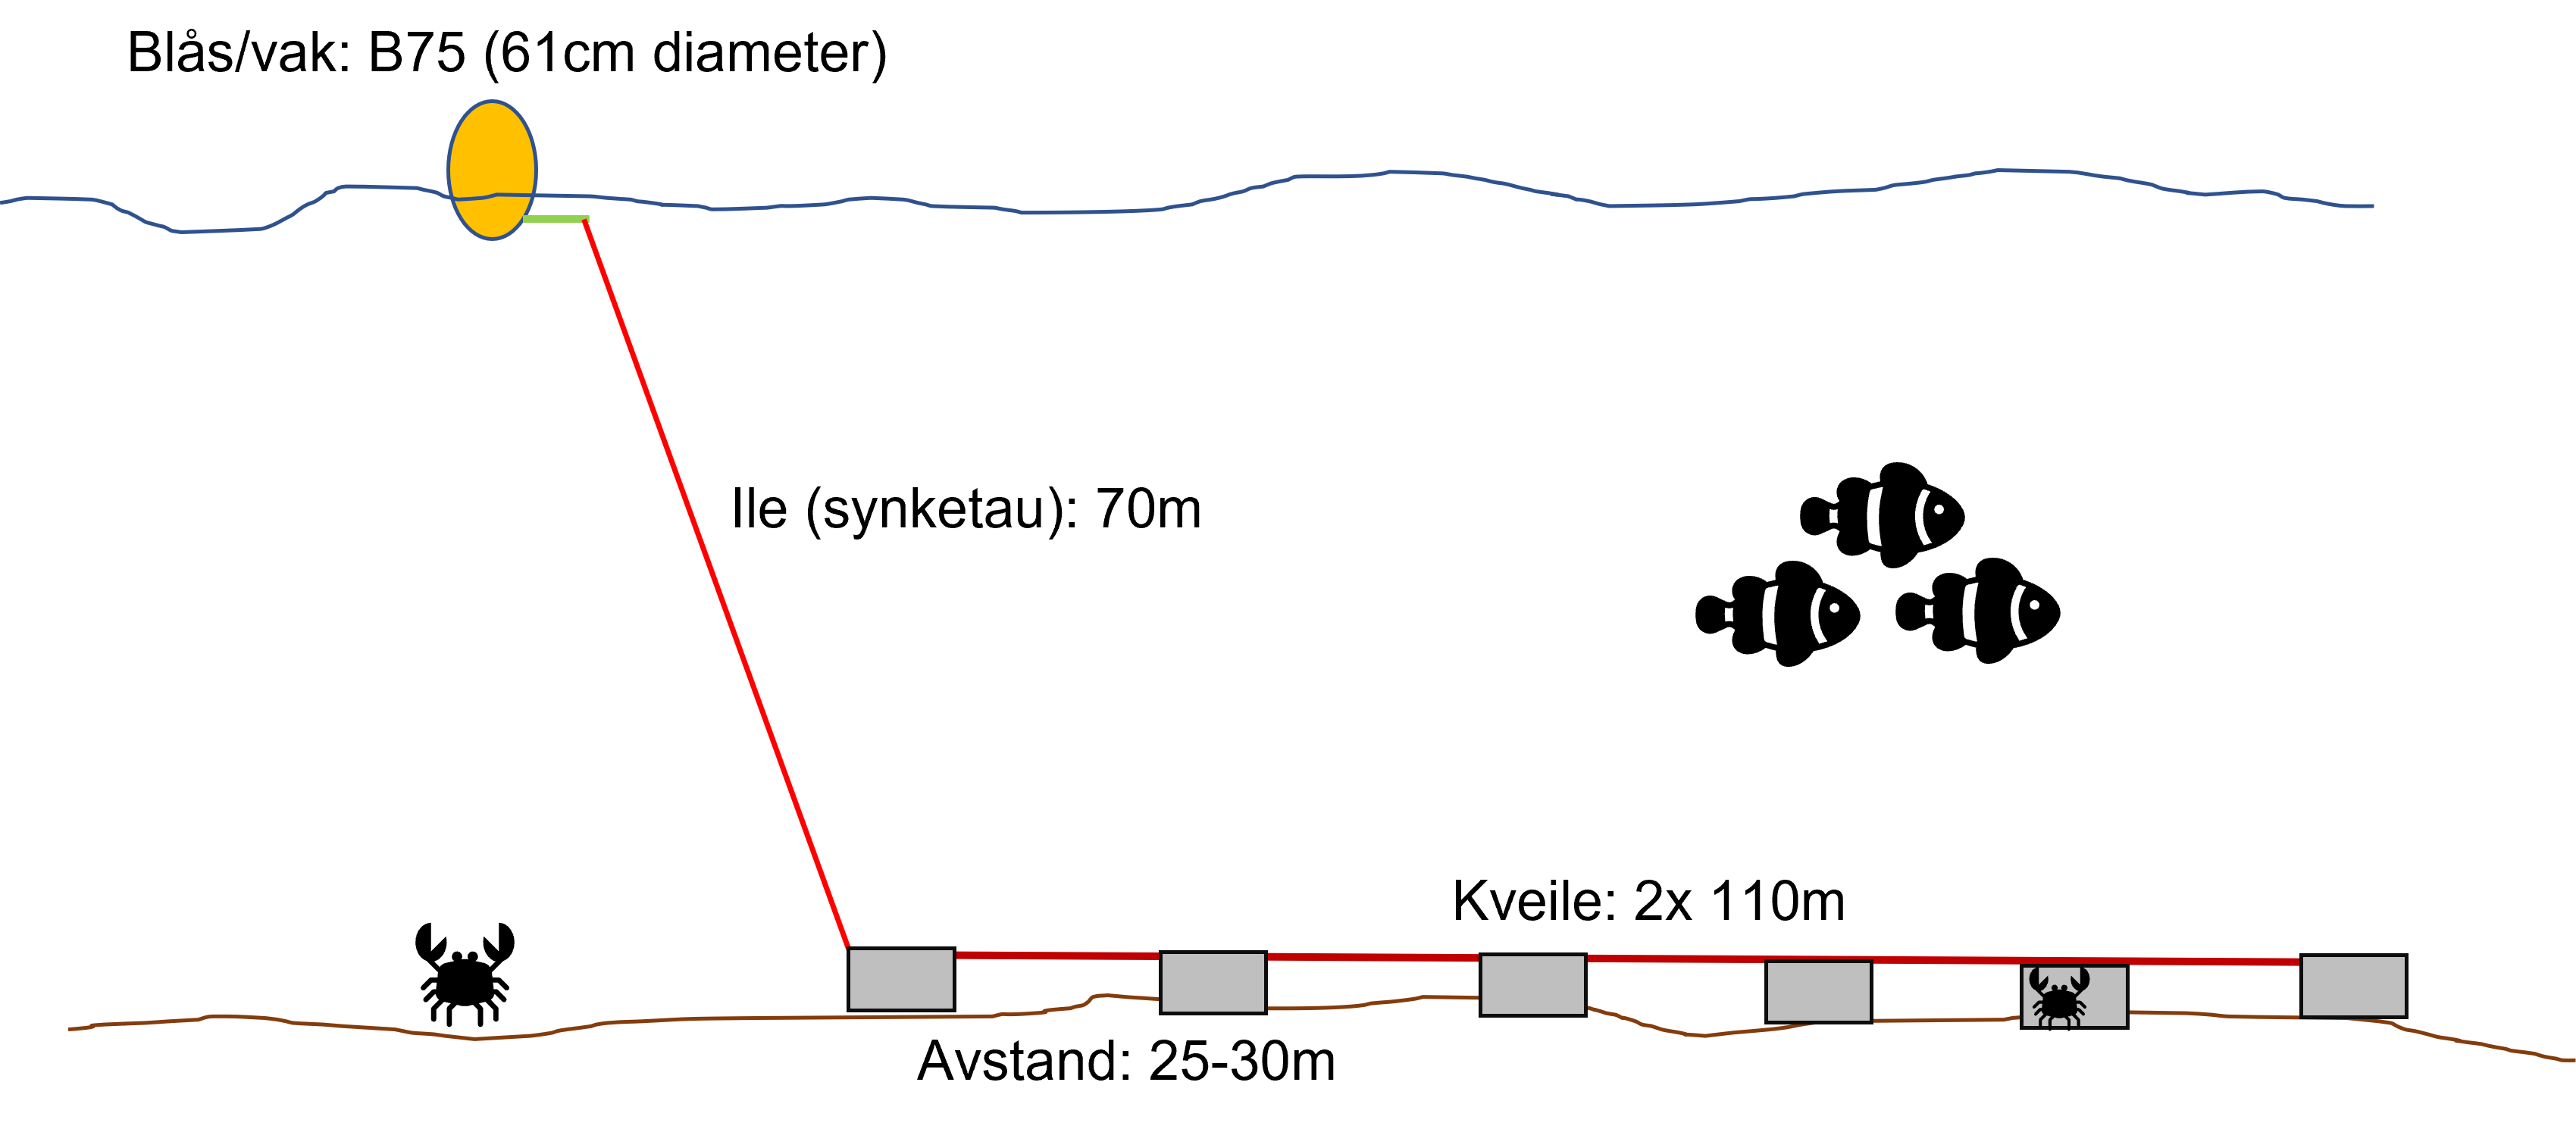
Figure 17: Schematic overview of the pot lines for brown crab in the 2023 survey in Vestlandet.
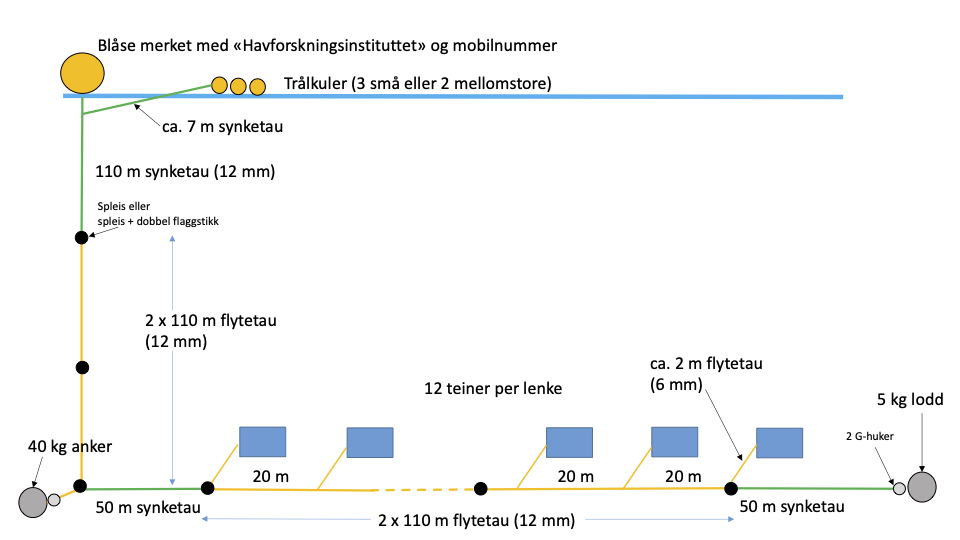
Figure 18: Schematic overview of the pot lines for Nephrops in the 2023 survey in Vestlandet.
6.3 - Appendix 3 – Catch distribution
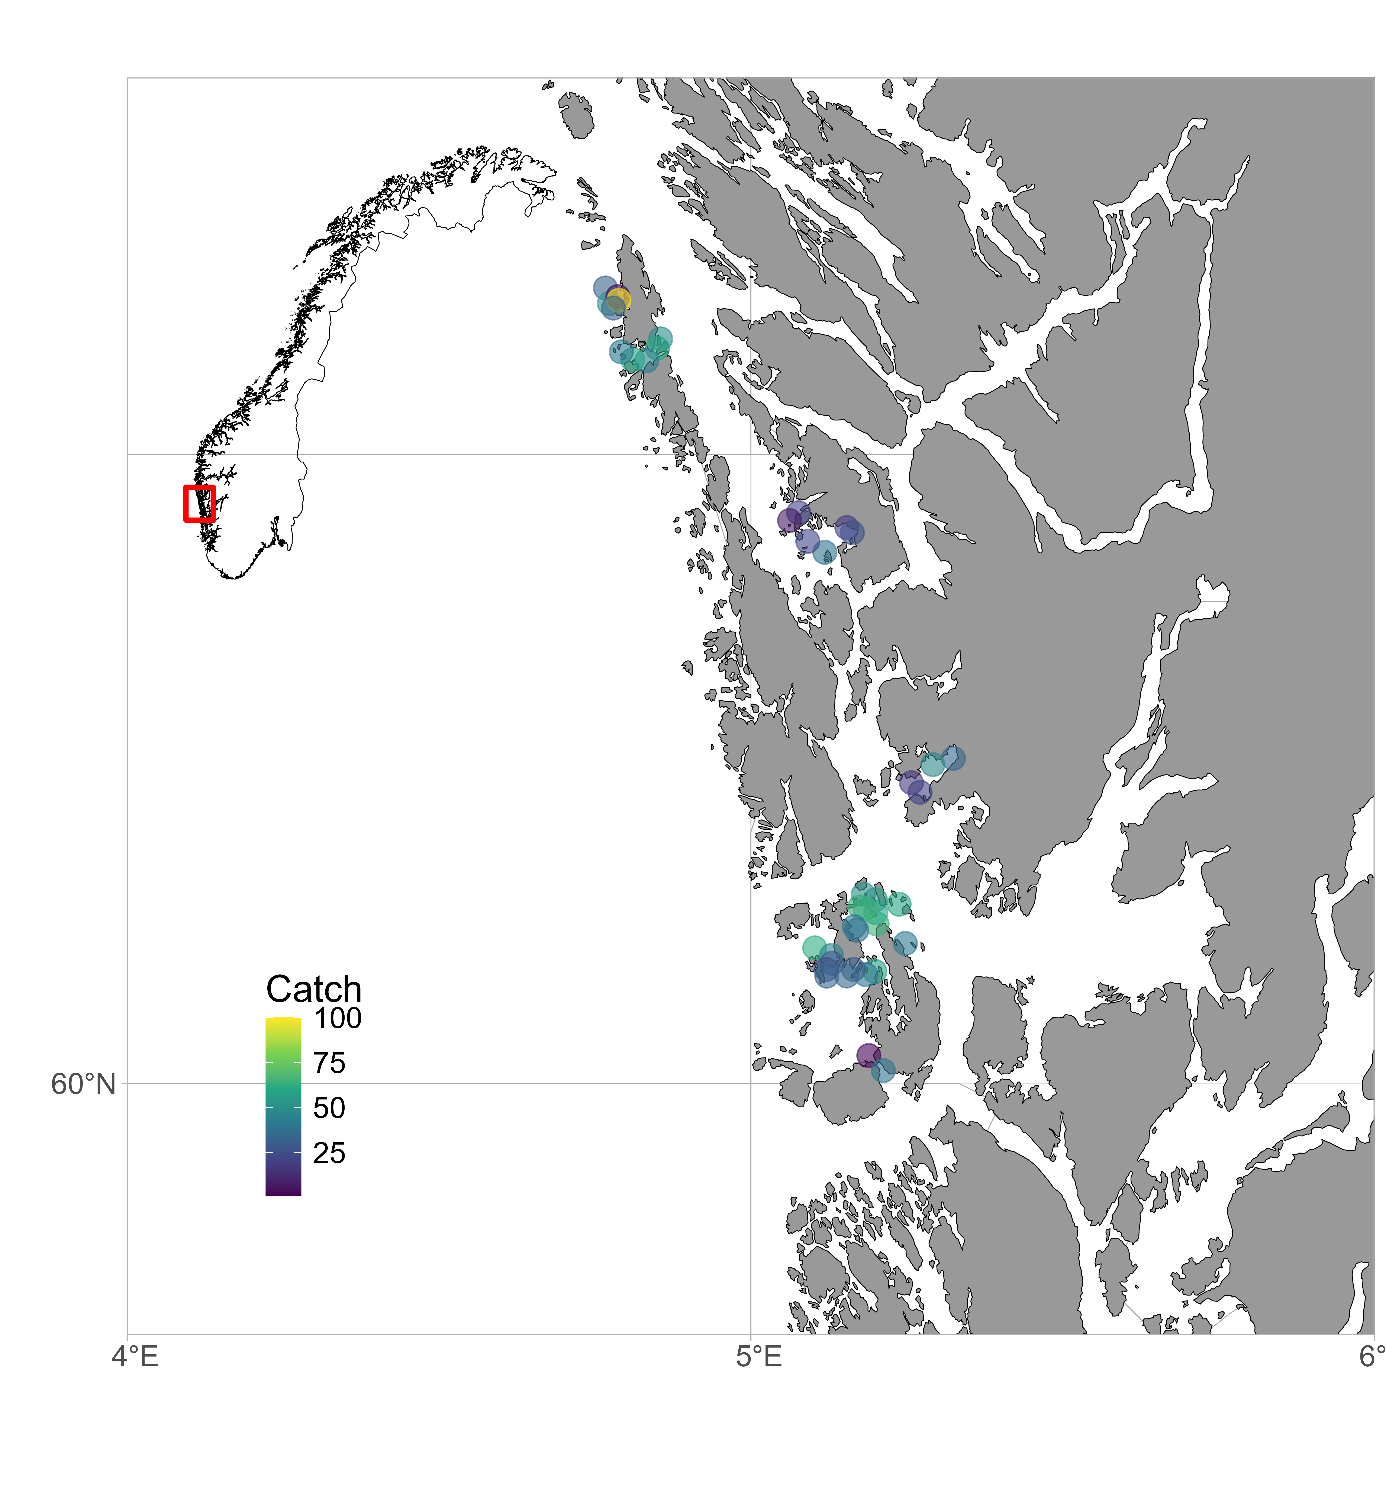
Figure 19: Map of brown crab (Cancer pagurus) catches per station during the survey in 2023. Brighter colours indicate higher catches.
6.4 - Appendix 4 - Weight-size relationship
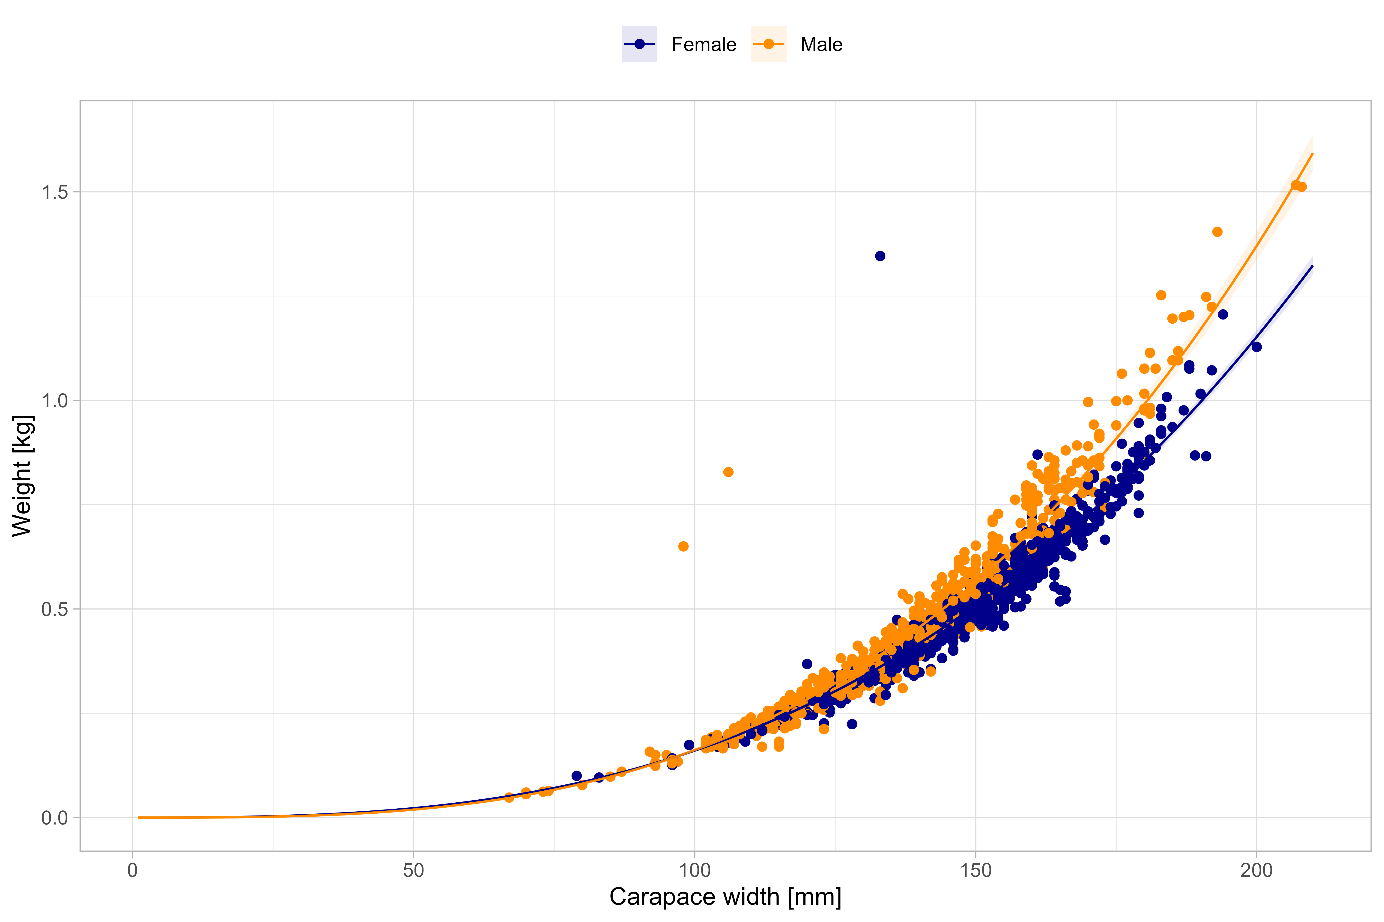
Figure 20: Relationship between size (carapace width, mm) and weight (kg) of individual brown crabs (Cancer pagurus), by sex, caught in the survey in Vestlandet in 2023. Lines and shaded areas show mean and 95% confidence intervals estimated from length-weight relationships (parameters given in Table 4).
Figure 21: Relationship between weight and size (carapace length) of individual Nephrops norvegicus, by sex, caught in the survey in Vestlandet in 2023 (left), and length of right claw for males in relation to carapace length from the surveys in Vestlandet in October 2023 and Frohavet in April–May 2023 (right). Lines and shaded areas show mean and 95% confidence intervals estimated from length-weight relationships by sex (left, parameters see Table 4) and linear regression (right).
Table 4. Sex-specific weight-size parameters for brown crab and Nephrops to convert size (length and width for Nephrops and crab, respectively) to weight with the function Weight= a*Sizeb.